Guest User!

You are not Sophos Staff.

This discussion has been locked.
You can no longer post new replies to this discussion. If you have a question you can start a new discussion

XG 550 Web interface VERY SLOW

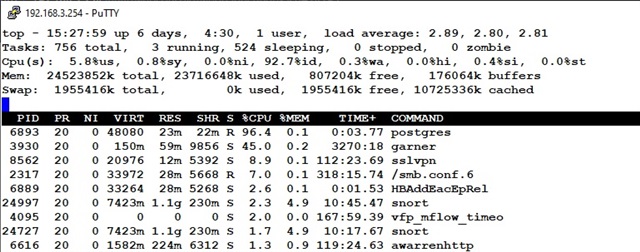
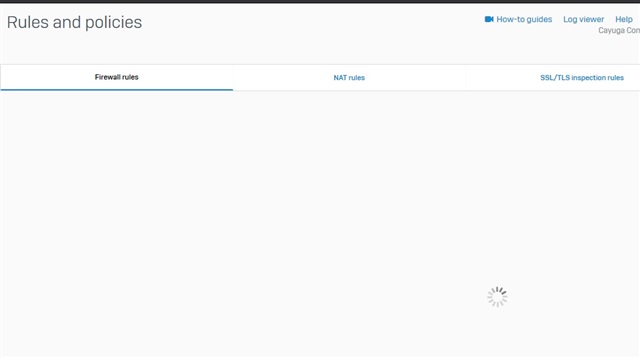
We have an XG 550 and from the beginning the web interface has been sluggish.  It has gotten worse and now sometimes moving between windows takes 30 seconds or more depending on what we are doing.  We just get the spinning wheel most of the time.  Memory/CPU utilization aren't very high at all (memory is less than 60%).  The main "control center" screen sometimes takes over a minute to fully load everything just so we can see bandwidth usage.  Is there any trick to speeding this up to a workable level?


Edited TAGs
[edited by: emmosophos at 6:49 PM (GMT -7) on 7 Jun 2021]
  • Assuming a object is broken, which cannot be loaded und runs into timeouts within the GUI.

    You could go to the shell, check the applog.log and csc.log to verify, if you click on firewall rules, there get any kind of errors, which could lead to timeouts of loading. 

  • Would this happen with a broken object even if the page does eventually load?  And why would I experience slowness on so many pages?  The "Control Center" doesn't spin, but is just very slow to load every time. Is that just normal because it does so many things?  Would those logs show that page as well?  Sorry I realize I am bombarding with questions here.

  • The Webadmin will load all the time all the objects and access them. This can eventually slow down everything, if there is a corrupt item. 

  • in csc.log, I did notice this set of messages, but am unsure if they are related.  Are these objects fixable without a factory default of the appliance? 

    WARNING   Mar 05 09:55:46  [/fwcm/fwcm-heartbeatd.conf:2317]: Action with NOFAIL Failed.
    MESSAGE   Mar 05 09:55:46  [worker:28220]: {"request":{"method":"opcode","name":"getpublickey","version":"1.6","type":"text","length":0}}
    MESSAGE   Mar 05 09:55:46  [getpublickey:28220]: nvram_get(newkey:1) succeed
    IFNAME_PREFIX: PortA
    IFNAME_SUFFIX: NUM
    IFLIST: A8_B8_C8_D8_M2
    MESSAGE   Mar 05 09:55:46  [worker:28239]: {"request":{"method":"opcode","name":"readobject","version":"1.2","type":"json","length":26,"data":{"Entity":"parentproxyv4"}}}
    ########## Package: system::parentproxyv4
    **********  parentproxyv4 Read Without ORM
    MESSAGE   Mar 05 09:55:47  [worker:28244]: {"request":{"method":"opcode","name":"readobject","version":"1.2","type":"json","length":26,"data":{"Entity":"parentproxyv6"}}}
    ########## Package: system::parentproxyv6
    **********  parentproxyv6 Read Without ORM
    ERROR     Mar 05 09:55:47  [/fwcm/fwcm-heartbeatd.conf:2317]: csc_execve: Child exited with status 240
    ERROR     Mar 05 09:55:47  [/fwcm/fwcm-heartbeatd.conf:2317]: log_exec: Failed Command: /bin/nvram get #fwcm.trx
    WARNING   Mar 05 09:55:47  [/fwcm/fwcm-heartbeatd.conf:2317]: Action with NOFAIL Failed.
    ERROR     Mar 05 09:55:47  [/fwcm/fwcm-heartbeatd.conf:2317]: csc_execve: Child exited with status 240
    ERROR     Mar 05 09:55:47  [/fwcm/fwcm-heartbeatd.conf:2317]: log_exec: Failed Command: /bin/nvram get #fwcm.trx_sts
    WARNING   Mar 05 09:55:47  [/fwcm/fwcm-heartbeatd.conf:2317]: Action with NOFAIL Failed.
    ERROR     Mar 05 09:55:47  [/fwcm/fwcm-heartbeatd.conf:2317]: csc_execve: Child exited with status 240
    ERROR     Mar 05 09:55:47  [/fwcm/fwcm-heartbeatd.conf:2317]: log_exec: Failed Command: /bin/nvram get #fwcm.grp_id
    WARNING   Mar 05 09:55:47  [/fwcm/fwcm-heartbeatd.conf:2317]: Action with NOFAIL Failed.

  • Those are normal alerts of CSC. As you are using one of the biggest appliances, both Logs will be under load, therefore its hard to debug within a community thread. You should interact with Sophos Support to get this looked at. 

  • Hi Josh,

    check the running processes in the CLI. Not every process is multithreaded so the CPU Load is not necessary a good indicator what is happening. 
    For example we had a testing environment that was bombarding the IDS/IPS with broadcast packets with random destination addresses.
    After disabling the IDS service or stopping the IDS process everything went back to normal. Just an example what could go wrong.

    Regards,
    Bernd

  • Thank you this slipped my mind.  I logged into the shell and ran "top" just to see.  postgres seems to be the biggest offender, taking up 96 or 97% at pretty much all times, followed by "garner" which takes up 35 to 46% almost all the time.  Everything else cycles up and down as I would expect.  Anyone else have this issue with postgres taking up so much? 

  • Is there any warning or errors inside /log/postgres.log ?

  • Strangely no, mostly just just a bunch of log entries for "GMTLOG:  unexpected EOF on client connection with an open transaction".  If you go back a few weeks you can find a few instances of "database system was interrupted" and other things, but nothing jumps right out besides a bunch of those "unexpected EOF" errors.

  • Is there any core dumps at /var/cores ? Either way you should open a support case, there's no apparent reason on why postgres should be pinning a single core of the appliance.