Guest User!

You are not Sophos Staff.

This discussion has been locked.
You can no longer post new replies to this discussion. If you have a question you can start a new discussion

Exec Report, Resource Usage empty

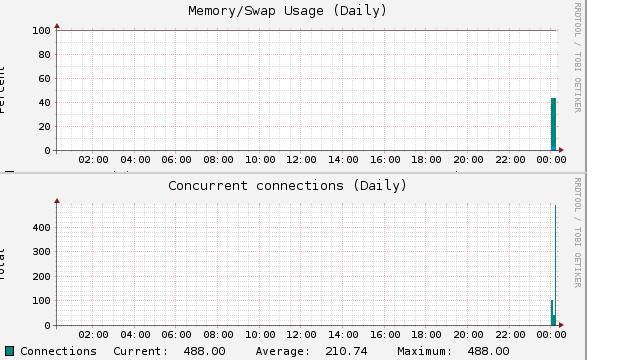
UTM 9.109-1 all of my resource graphs in the daily Executive Report are empty for almost 24 hours. The system has not been down, the report says it has been up for 23 days. 

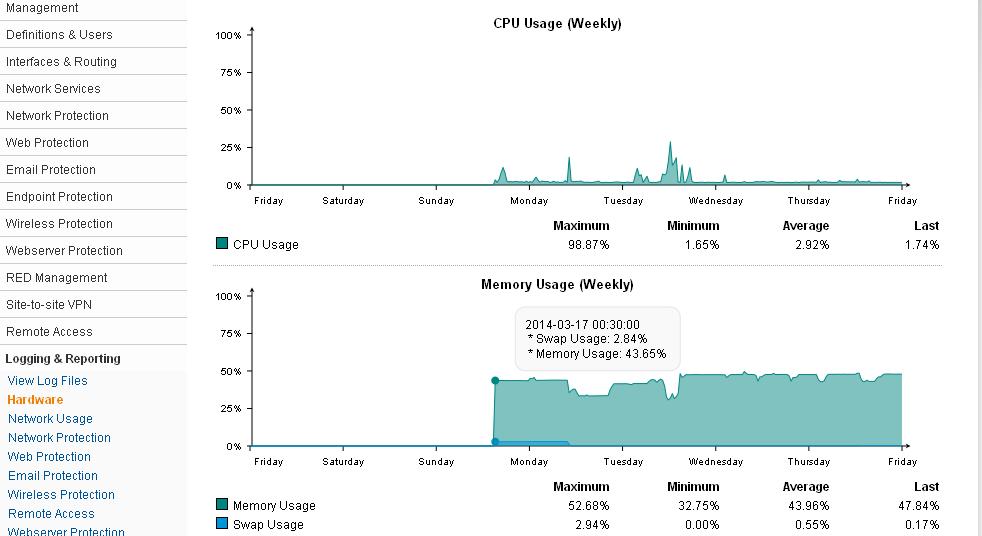
Adding to the mystery, when I look at any graph in Logging & Reporting they are all empty (Weekly & Monthly) seeming to start at 00:05 last night. At that point they all seem to pick up where they left off (IE. Storage is at 55%) But if I look at Network Usage - Bandwidth Usage I can get reporting for today, yesterday, last 7 days, etc. 

The graphs look just like they would if I had done a fresh install or the system had been down for a long time.


This thread was automatically locked due to age.
  • Michael, I'm not sure what your question is.  Have you tried a reboot?

    Cheers - Bob
     
    Sophos UTM Community Moderator
    Sophos Certified Architect - UTM
    Sophos Certified Engineer - XG
    Gold Solution Partner since 2005
    MediaSoft, Inc. USA
  • I simply get a bit concerned when something just disappears and then comes back. I did not have to restart, all the graphs were populated again in the next report. While all the statistics seem to be there in numeric form if I look at a my Sunday report EVERY graph was empty.

    It is now Wednesday and if I go into Logging & Reporting and look at any weekly graph it's as if the system was installed at 00:00:00 Monday morning. The graphs are not pulling any data from before that time. I assume there is data because if I go to Network Usage, Bandwidth Usage and select 7 days I get one number then for 30 days and I get a bigger number. Why would all the graph information seem to be gone?
  • My guess would be that this was a browser issue and that you've rebooted your PC since you saw the problem.

    Cheers - Bob
     
    Sophos UTM Community Moderator
    Sophos Certified Architect - UTM
    Sophos Certified Engineer - XG
    Gold Solution Partner since 2005
    MediaSoft, Inc. USA
  • Thank you for being the only one that has replied to my post but you're missing the details and I need details.

    Something has obviously wiped out the history information that populates the graphs. It happened around midnight last Saturday, the graphs in my Sunday Executive Report are blank even in the archived PDF report (all numeric statistics are populated) and it picks up again after midnight Sunday. 

    After this, I go into the system under Logging & Reporting and look at any Weekly or Monthly graph and they 'start' at just past midnight on Monday morning (see attached graph). I monitor six systems, this is the only one it happened to and it just happens to be my own personal use system or I would have contacted support.

    Does anyone know where/what files store this information or what might have deleted this information if it's gone?
  • OK, there are two different things you can try at the command line.

    First, try recreating the indexes of the Reporting databases: 
    psql -Ureporting -c"reindex database reporting;" reporting


    If that gives no joy, try recreating the graphs (this is my best guess as to what will fix your problem, but be sure you're in the /var/log/reporting/rrd directory before you delete everything with the rm command):
    cd /var/log/reporting/rrd
    rm *
    cd /etc/init.d
    ./syslogng restart
    ./rrdcache restart
    cd /usr/local/bin/reporter
    ./system-reporter.pl


    Any luck with either of those?  If not, then my guess is that some glitch zapped the databases.  You might want to go ahead and re-initialize  the reporting database (deletes all data):
    /etc/init.d/postgresql92 rebuild


    Cheers - ob
     
    Sophos UTM Community Moderator
    Sophos Certified Architect - UTM
    Sophos Certified Engineer - XG
    Gold Solution Partner since 2005
    MediaSoft, Inc. USA
  • Thanks, I will try this.

    Just as an added note, exactly 7 days after I experienced this on my system, the same thing occurred to two of my production systems and I have contacted support about those.

    Having this happen on Saturday midnight on all 3 systems is a bit beyond just odd.
Share Feedback
×

Submitted a Tech Support Case lately from the Support Portal?