

Hi,
not sure if this is normal for an ASG 320HA. V8.103
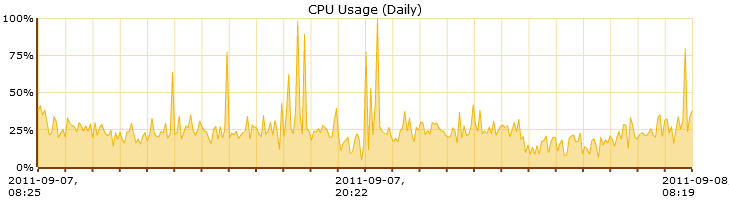
It looks like that the performance is very high. The CPU usage is between 20-50 % permanently.
Does a proxy with activated single scan engine does take so much resources?
2 500 000/requests per day / logging enabled
some mail traffic (below 5000 mails/day)
This box is designed (data sheet) to manage 600 000 concurrent sessions and 165 Mbit/s UTM throughput.
Cheers,
top - 08:17:37 up 62 days, 8 min, 2 users, load average: 0.53, 0.59, 0.50
Tasks: 150 total, 1 running, 147 sleeping, 0 stopped, 2 zombie
Cpu(s): 18.0%us, 4.0%sy, 0.0%ni, 78.0%id, 0.0%wa, 0.0%hi, 0.0%si, 0.0%st
Mem: 2068092k total, 1935700k used, 132392k free, 338316k buffers
Swap: 1052248k total, 159920k used, 892328k free, 903736k cached
PID USER PR NI VIRT RES SHR S %CPU %MEM TIME+ COMMAND
9963 postgres 20 0 49848 36m 35m S 5.6 1.8 2854:41 postgres
9436 postgres 20 0 49700 37m 36m S 5.3 1.8 2715:34 postgres
5154 root 19 -1 6356 3652 872 S 1.0 0.2 1632:38 ulogd
5548 root 15 -5 9560 5964 404 S 0.7 0.3 1934:07 conntrackd
6012 root 20 0 7404 3276 1232 S 0.7 0.2 1878:26 syslog-ng
26668 root 20 0 33100 14m 4088 S 0.7 0.7 0:14.84 smtpd.bin
top - 08:19:53 up 62 days, 10 min, 2 users, load average: 0.82, 0.66, 0.54
Tasks: 153 total, 5 running, 146 sleeping, 0 stopped, 2 zombie
Cpu(s): 43.0%us, 16.4%sy, 0.0%ni, 29.2%id, 0.3%wa, 1.3%hi, 9.8%si, 0.0%st
Mem: 2068092k total, 1949860k used, 118232k free, 339220k buffers
Swap: 1052248k total, 159920k used, 892328k free, 915424k cached
PID USER PR NI VIRT RES SHR S %CPU %MEM TIME+ COMMAND
6086 httpprox 20 0 387m 156m 3676 R 11.9 7.8 3369:39 httpproxy
20469 root 20 0 17288 9456 3512 S 10.9 0.5 13:53.43 websec-reporter
6012 root 20 0 7404 3276 1232 S 7.3 0.2 1878:31 syslog-ng
5548 root 15 -5 9560 5964 404 S 6.3 0.3 1934:11 conntrackd
9963 postgres 20 0 49848 36m 35m R 5.0 1.8 2854:47 postgres
5154 root 19 -1 6356 3652 872 S 4.6 0.2 1632:41 ulogd
31841 root 20 0 2324 1104 808 R 3.3 0.1 0:00.10 csync2
26668 root 20 0 33100 14m 4088 S 2.7 0.7 0:17.51 smtpd.bin
9436 postgres 20 0 49700 37m 36m S 1.7 1.8 2715:39 postgres
This thread was automatically locked due to age.


