1) The ASG 110 (v 7.03 - up2date is working correctly) was reinstalled with the RMA#2 USB sent to me by us tech support, in late Nov. Nothing as "root" has been touched previously to your checklist, except the password.
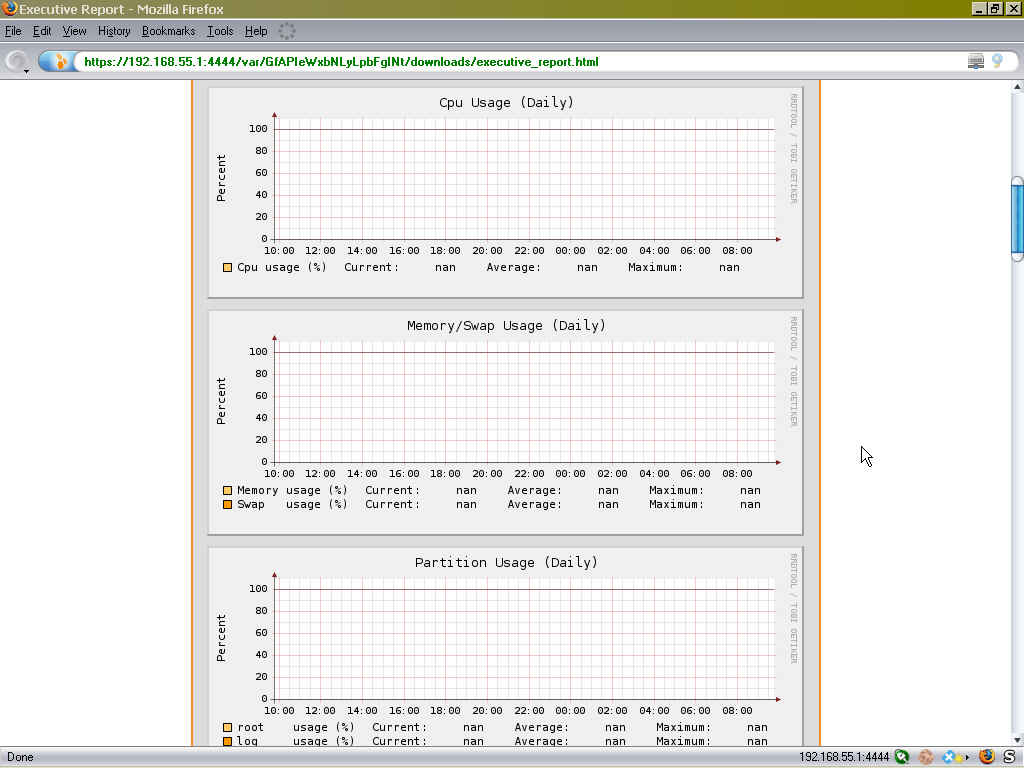
2) I am attaching two screen images of the system. The jpg files don't show great detail. The ASG had uptime of 3 days plus when the original thread was started. But the enclosed "dashboard2" file shows only a short time, the system was restarted;the originally created "bmp" file was not in your list below.
3) The charts were displayed, but were void of data, in every chart displayed, from the beginning, (i.e. no data has ever been displayed)
4) From your checklist #6: (a) "images" dir contained files: updated every 15 minutes; (b) "accu" dir contained files: updated ever 5 minutes; (c) "rrd" dir contained files" not being updated (all are dated Oct 30 2110 - which I recall as the default system date found after the initial installation, prior to NTP being setup.) (d) "current_reporting.ph" was not present on the system. I created that directory, but no files have populated the dir over the past several hours.
5) "Cron" was checked: (a) ran "ps -C cron" - cron was running; (b) viewing the "/var/log/system.log" file uncovered that the sytem was reporting the process execution every 5 minutes, as outlined in the checklist.
6) Finally, I run "/usr/local/bin/reportcontrol.sh" and rechecked dirs: no change in any directory, except "accu" in which the files were recreated.
1) The ASG 110 (v 7.03 - up2date is working correctly) was reinstalled with the RMA#2 USB sent to me by us tech support, in late Nov. Nothing as "root" has been touched previously to your checklist, except the password.
2) I am attaching two screen images of the system. The jpg files don't show great detail. The ASG had uptime of 3 days plus when the original thread was started. But the enclosed "dashboard2" file shows only a short time, the system was restarted;the originally created "bmp" file was not in your list below.
3) The charts were displayed, but were void of data, in every chart displayed, from the beginning, (i.e. no data has ever been displayed)
4) From your checklist #6: (a) "images" dir contained files: updated every 15 minutes; (b) "accu" dir contained files: updated ever 5 minutes; (c) "rrd" dir contained files" not being updated (all are dated Oct 30 2110 - which I recall as the default system date found after the initial installation, prior to NTP being setup.) (d) "current_reporting.ph" was not present on the system. I created that directory, but no files have populated the dir over the past several hours.
5) "Cron" was checked: (a) ran "ps -C cron" - cron was running; (b) viewing the "/var/log/system.log" file uncovered that the sytem was reporting the process execution every 5 minutes, as outlined in the checklist.
6) Finally, I run "/usr/local/bin/reportcontrol.sh" and rechecked dirs: no change in any directory, except "accu" in which the files were recreated.
4) From your checklist #6: (a) "images" dir contained files: updated every 15 minutes; (b) "accu" dir contained files: updated ever 5 minutes; (c) "rrd" dir contained files" not being updated (all are dated Oct 30 2110 - which I recall as the default system date found after the initial installation, prior to NTP being setup.) (d) "current_reporting.ph" was not present on the system. I created that directory, but no files have populated the dir over the past several hours.
Hi,
that checklist is more than 3 1/2 years old, but at least parts of it do still apply, so thanks for going through it. It looks like the problem is pretty easy to spot with the information you gave: a file modification time of Oct 30 2110. RRD is very strict about writing data to it's archives and will deny entering data into a file when it thinks the data is older than the latest entry. Why the initial installation time was off by more than a century completely evades me, but to get graphs working again you only need to delete the rrd files with the modification time in the future. The reporting backend will automatically re-create them, and you will have data in your charts in a matter of 30 minutes.


