This discussion has been locked.
You can no longer post new replies to this discussion. If you have a question you can start a new discussion

Memory Useage increase over a few days time

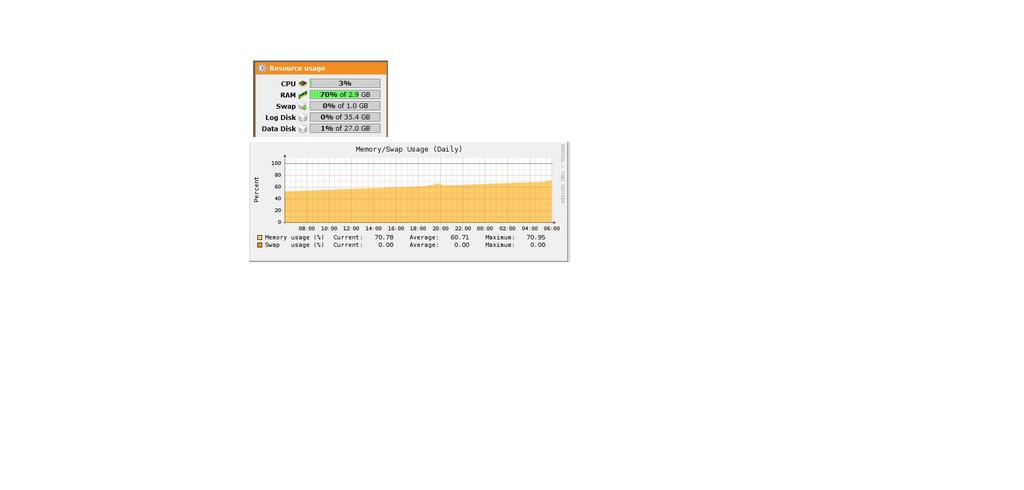
Hi I am running the latest ASG 7.501 pattern version  11169, and i have noticed that memory usage reported on the dashboard increases drastically over a 3 day time period. I only have 2 packet filter rules specified and the output of top does not indicate anything out of the ordinary.  Is this an issue that i should be worried about. I am running ASG on an Intel socket 775 3.0Ghz 2mb L2 cache with hyper-threading, i have 3 GB of ram installed and currently the dashboard shows i am using 70% of my ram..i am not sure why this is so high but my reporting indicates this increase is constantly going up


This thread was automatically locked due to age.
Parents
  • I'll try removing a stick of RAM, however counter-intuitive that sounds.  Also, does ASG not support hyper threading?  At any rate, here's what it looks like after 48 hours with nothing open and actually very little traffic.  I'm going to let it go for a couple more days and see what happens:

    top - 13:08:49 up 2 days,  4:15,  1 user,  load average: 0.06, 0.04, 0.00
    Tasks: 138 total,   1 running, 135 sleeping,   0 stopped,   2 zombie
    Cpu0  :  0.7%us,  0.0%sy,  0.0%ni, 99.3%id,  0.0%wa,  0.0%hi,  0.0%si,  0.0%st
    Cpu1  :  0.0%us,  0.0%sy,  0.0%ni,100.0%id,  0.0%wa,  0.0%hi,  0.0%si,  0.0%st
    Cpu2  :  0.0%us,  0.0%sy,  0.0%ni,100.0%id,  0.0%wa,  0.0%hi,  0.0%si,  0.0%st
    Cpu3  :  0.3%us,  0.0%sy,  0.0%ni, 99.7%id,  0.0%wa,  0.0%hi,  0.0%si,  0.0%st
    Cpu4  :  0.0%us,  0.0%sy,  0.0%ni,100.0%id,  0.0%wa,  0.0%hi,  0.0%si,  0.0%st
    Cpu5  :  0.0%us,  0.3%sy,  0.0%ni, 99.7%id,  0.0%wa,  0.0%hi,  0.0%si,  0.0%st
    Cpu6  :  0.0%us,  0.3%sy,  0.0%ni, 98.7%id,  1.0%wa,  0.0%hi,  0.0%si,  0.0%st
    Cpu7  :  0.0%us,  0.0%sy,  0.0%ni, 99.3%id,  0.7%wa,  0.0%hi,  0.0%si,  0.0%st
    Mem:   3617348k total,  3084172k used,   533176k free,   408188k buffers
    Swap:  1052248k total,        0k used,  1052248k free,   791808k cached

      PID USER      PR  NI  VIRT  RES  SHR S %CPU %MEM    TIME+  COMMAND
     4883 root      15  -1  200m 174m 1888 S    0  4.9   1:44.58 snort_inline
     5131 root      14  -1  200m 174m 1852 S    0  4.9   1:28.25 snort_inline
     5118 root      15  -1  200m 174m 1828 S    0  4.9   1:34.68 snort_inline
     4130 chroot    16   0  251m  82m 4292 S    0  2.3   4:20.34 httpproxy
     4879 chroot    16   0 99812  79m 1136 S    0  2.3   0:06.24 clamd
     4058 root      16   0  105m  74m 3104 S    0  2.1   1:33.87 cssd
     3308 root      15   0 51104  46m 3580 S    0  1.3   0:08.43 mdw_daemon.plx
     9290 root      16   0 34784  19m 2408 S    0  0.5   0:00.27 confd.plx
     3012 root      15   0 31452  17m 3784 S    0  0.5   0:02.96 confd.plx
     4413 root      15   0 24256  16m 2416 S    0  0.5   1:53.32 smtpd.bin
     4606 root      16   0 23968  15m 1912 S    0  0.5   0:00.11 smtpd.bin
     9288 wwwrun    16   0 22288  15m 3220 S    0  0.4   0:00.84 index.plx
     3078 root      15   0 30664  14m 1428 S    0  0.4   0:01.68 confd.plx
     3110 root      16   0 19708  13m 3408 S    0  0.4   0:01.12 notifier.plx
     3255 postgres  15   0 48968  10m  10m S    0  0.3   0:01.13 postgres
     3083 root      15   0 16764  10m 1816 S    0  0.3   0:00.05 aua.bin
     3015 root      16   0 13792  10m 2096 S    0  0.3   0:30.49 dns-resolver.pl
     3632 root      17   0 12724 9980 1708 S    0  0.3   0:21.34 named
     4454 root      19   0 43676 9964 7204 S    0  0.3   0:35.92 ctasd
     3333 root      15   0 14844 9600 2588 S    1  0.3  15:14.17 selfmonng.plx
     3992 postgres  16   0 49656 9172 8216 S    0  0.3   0:01.42 postgres
    26420 root      16   0 11708 9152 2796 S    0  0.3   0:02.35 pfilter-reporte
    26419 root      16   0 11660 9000 2700 S    0  0.2   0:02.08 ips-reporter.pl
    26421 root      16   0 10484 8760 2524 S    0  0.2   0:01.44 admin-reporter.
    26413 root      16   0 10968 8340 2736 S    0  0.2   0:02.50 websec-reporter
     4128 afcd      14  -1 10732 8156 1084 S    0  0.2   2:42.01 afcd
    26414 root      16   0 10576 8024 2736 S    0  0.2   0:01.02 mailsec-reporte
     3369 root      16   0 14588 7312  540 S    0  0.2   0:00.00 selfmonng.plx
     3248 postgres  16   0 48832 5336 5004 S    0  0.1   0:01.75 postgres
     4882 postgres  16   0 50016 5320 4248 S    0  0.1   0:00.17 postgres
     3048 root      16   0  8168 5224 1528 S    0  0.1   0:00.11 sysmond
    26415 root      16   0  7588 5160 2052 S    0  0.1   0:00.35 vpn-reporter.pl
     4756 root      34  19  9420 5144 1716 S    0  0.1   0:00.21 snmpd
     9291 postgres  16   0 50056 5120 3904 S    0  0.1   0:00.15 postgres
    16022 postgres  16   0 50056 4728 3548 S    0  0.1   0:05.96 postgres
     4065 postgres  16   0 50008 3976 2980 S    0  0.1   0:00.07 postgres
     2958 root      16   0  5300 3884 1424 S    0  0.1   0:00.39 hald
     3968 root      16   0  7256 3124 2256 S    0  0.1   0:00.25 httpd
     9357 wwwrun    16   0  7656 3076 1864 S    0  0.1   0:00.01 httpd
     9356 wwwrun    16   0  7512 2836 1828 S    0  0.1   0:00.00 httpd
     4881 chroot    16   0  7340 2328 1884 S    0  0.1   0:00.73 exim
    19231 root      17   0  7220 2308 1772 S    0  0.1   0:00.02 sshd
     3971 wwwrun    16   0  7192 1864  992 S    0  0.1   0:00.00 httpd
    19234 loginuse  15   0  3116 1640 1236 S    0  0.0   0:00.01 bash
     4002 root      15   0  2652 1612  604 S    0  0.0   0:17.51 syslog-ng
    19233 loginuse  16   0  7220 1520  984 S    0  0.0   0:00.00 sshd
     4061 root      17   0  5712 1380 1108 S    0  0.0   0:00.00 pop3proxy
     3257 postgres  16   0 49104 1344  784 S    0  0.0   0:00.02 postgres
     4122 root      16   0  4396 1344  692 S    0  0.0   0:00.36 dhcpd
     5351 root      16   0  3680 1176  916 S    0  0.0   0:00.23 ntpd
    19280 loginuse  16   0  2296 1168  836 R    0  0.0   0:00.10 top
     3364 root      15  -1  2788 1100  680 S    0  0.0   0:13.04 ulogd
     3760 root      16   0  4632 1092  768 S    0  0.0   0:00.00 sshd
     3258 postgres  15   0  6984 1060  560 S    0  0.0   0:02.23 postgres
     3256 postgres  15   0 48832  984  640 S    0  0.0   0:00.34 postgres
     4453 root      16   0  6404  968  208 S    0  0.0   0:00.00 ctasd
     2751 messageb  15   0  3416  928  728 S    0  0.0   0:00.05 dbus-daemon
     3742 root      16   0  1804  716  576 S    0  0.0   0:00.14 cron
Reply
  • I'll try removing a stick of RAM, however counter-intuitive that sounds.  Also, does ASG not support hyper threading?  At any rate, here's what it looks like after 48 hours with nothing open and actually very little traffic.  I'm going to let it go for a couple more days and see what happens:

    top - 13:08:49 up 2 days,  4:15,  1 user,  load average: 0.06, 0.04, 0.00
    Tasks: 138 total,   1 running, 135 sleeping,   0 stopped,   2 zombie
    Cpu0  :  0.7%us,  0.0%sy,  0.0%ni, 99.3%id,  0.0%wa,  0.0%hi,  0.0%si,  0.0%st
    Cpu1  :  0.0%us,  0.0%sy,  0.0%ni,100.0%id,  0.0%wa,  0.0%hi,  0.0%si,  0.0%st
    Cpu2  :  0.0%us,  0.0%sy,  0.0%ni,100.0%id,  0.0%wa,  0.0%hi,  0.0%si,  0.0%st
    Cpu3  :  0.3%us,  0.0%sy,  0.0%ni, 99.7%id,  0.0%wa,  0.0%hi,  0.0%si,  0.0%st
    Cpu4  :  0.0%us,  0.0%sy,  0.0%ni,100.0%id,  0.0%wa,  0.0%hi,  0.0%si,  0.0%st
    Cpu5  :  0.0%us,  0.3%sy,  0.0%ni, 99.7%id,  0.0%wa,  0.0%hi,  0.0%si,  0.0%st
    Cpu6  :  0.0%us,  0.3%sy,  0.0%ni, 98.7%id,  1.0%wa,  0.0%hi,  0.0%si,  0.0%st
    Cpu7  :  0.0%us,  0.0%sy,  0.0%ni, 99.3%id,  0.7%wa,  0.0%hi,  0.0%si,  0.0%st
    Mem:   3617348k total,  3084172k used,   533176k free,   408188k buffers
    Swap:  1052248k total,        0k used,  1052248k free,   791808k cached

      PID USER      PR  NI  VIRT  RES  SHR S %CPU %MEM    TIME+  COMMAND
     4883 root      15  -1  200m 174m 1888 S    0  4.9   1:44.58 snort_inline
     5131 root      14  -1  200m 174m 1852 S    0  4.9   1:28.25 snort_inline
     5118 root      15  -1  200m 174m 1828 S    0  4.9   1:34.68 snort_inline
     4130 chroot    16   0  251m  82m 4292 S    0  2.3   4:20.34 httpproxy
     4879 chroot    16   0 99812  79m 1136 S    0  2.3   0:06.24 clamd
     4058 root      16   0  105m  74m 3104 S    0  2.1   1:33.87 cssd
     3308 root      15   0 51104  46m 3580 S    0  1.3   0:08.43 mdw_daemon.plx
     9290 root      16   0 34784  19m 2408 S    0  0.5   0:00.27 confd.plx
     3012 root      15   0 31452  17m 3784 S    0  0.5   0:02.96 confd.plx
     4413 root      15   0 24256  16m 2416 S    0  0.5   1:53.32 smtpd.bin
     4606 root      16   0 23968  15m 1912 S    0  0.5   0:00.11 smtpd.bin
     9288 wwwrun    16   0 22288  15m 3220 S    0  0.4   0:00.84 index.plx
     3078 root      15   0 30664  14m 1428 S    0  0.4   0:01.68 confd.plx
     3110 root      16   0 19708  13m 3408 S    0  0.4   0:01.12 notifier.plx
     3255 postgres  15   0 48968  10m  10m S    0  0.3   0:01.13 postgres
     3083 root      15   0 16764  10m 1816 S    0  0.3   0:00.05 aua.bin
     3015 root      16   0 13792  10m 2096 S    0  0.3   0:30.49 dns-resolver.pl
     3632 root      17   0 12724 9980 1708 S    0  0.3   0:21.34 named
     4454 root      19   0 43676 9964 7204 S    0  0.3   0:35.92 ctasd
     3333 root      15   0 14844 9600 2588 S    1  0.3  15:14.17 selfmonng.plx
     3992 postgres  16   0 49656 9172 8216 S    0  0.3   0:01.42 postgres
    26420 root      16   0 11708 9152 2796 S    0  0.3   0:02.35 pfilter-reporte
    26419 root      16   0 11660 9000 2700 S    0  0.2   0:02.08 ips-reporter.pl
    26421 root      16   0 10484 8760 2524 S    0  0.2   0:01.44 admin-reporter.
    26413 root      16   0 10968 8340 2736 S    0  0.2   0:02.50 websec-reporter
     4128 afcd      14  -1 10732 8156 1084 S    0  0.2   2:42.01 afcd
    26414 root      16   0 10576 8024 2736 S    0  0.2   0:01.02 mailsec-reporte
     3369 root      16   0 14588 7312  540 S    0  0.2   0:00.00 selfmonng.plx
     3248 postgres  16   0 48832 5336 5004 S    0  0.1   0:01.75 postgres
     4882 postgres  16   0 50016 5320 4248 S    0  0.1   0:00.17 postgres
     3048 root      16   0  8168 5224 1528 S    0  0.1   0:00.11 sysmond
    26415 root      16   0  7588 5160 2052 S    0  0.1   0:00.35 vpn-reporter.pl
     4756 root      34  19  9420 5144 1716 S    0  0.1   0:00.21 snmpd
     9291 postgres  16   0 50056 5120 3904 S    0  0.1   0:00.15 postgres
    16022 postgres  16   0 50056 4728 3548 S    0  0.1   0:05.96 postgres
     4065 postgres  16   0 50008 3976 2980 S    0  0.1   0:00.07 postgres
     2958 root      16   0  5300 3884 1424 S    0  0.1   0:00.39 hald
     3968 root      16   0  7256 3124 2256 S    0  0.1   0:00.25 httpd
     9357 wwwrun    16   0  7656 3076 1864 S    0  0.1   0:00.01 httpd
     9356 wwwrun    16   0  7512 2836 1828 S    0  0.1   0:00.00 httpd
     4881 chroot    16   0  7340 2328 1884 S    0  0.1   0:00.73 exim
    19231 root      17   0  7220 2308 1772 S    0  0.1   0:00.02 sshd
     3971 wwwrun    16   0  7192 1864  992 S    0  0.1   0:00.00 httpd
    19234 loginuse  15   0  3116 1640 1236 S    0  0.0   0:00.01 bash
     4002 root      15   0  2652 1612  604 S    0  0.0   0:17.51 syslog-ng
    19233 loginuse  16   0  7220 1520  984 S    0  0.0   0:00.00 sshd
     4061 root      17   0  5712 1380 1108 S    0  0.0   0:00.00 pop3proxy
     3257 postgres  16   0 49104 1344  784 S    0  0.0   0:00.02 postgres
     4122 root      16   0  4396 1344  692 S    0  0.0   0:00.36 dhcpd
     5351 root      16   0  3680 1176  916 S    0  0.0   0:00.23 ntpd
    19280 loginuse  16   0  2296 1168  836 R    0  0.0   0:00.10 top
     3364 root      15  -1  2788 1100  680 S    0  0.0   0:13.04 ulogd
     3760 root      16   0  4632 1092  768 S    0  0.0   0:00.00 sshd
     3258 postgres  15   0  6984 1060  560 S    0  0.0   0:02.23 postgres
     3256 postgres  15   0 48832  984  640 S    0  0.0   0:00.34 postgres
     4453 root      16   0  6404  968  208 S    0  0.0   0:00.00 ctasd
     2751 messageb  15   0  3416  928  728 S    0  0.0   0:00.05 dbus-daemon
     3742 root      16   0  1804  716  576 S    0  0.0   0:00.14 cron
Children
No Data