

Version 7.075 running on a Pentium 3 1Ghz system, 512MB RAM, 80GB IDE HDD.
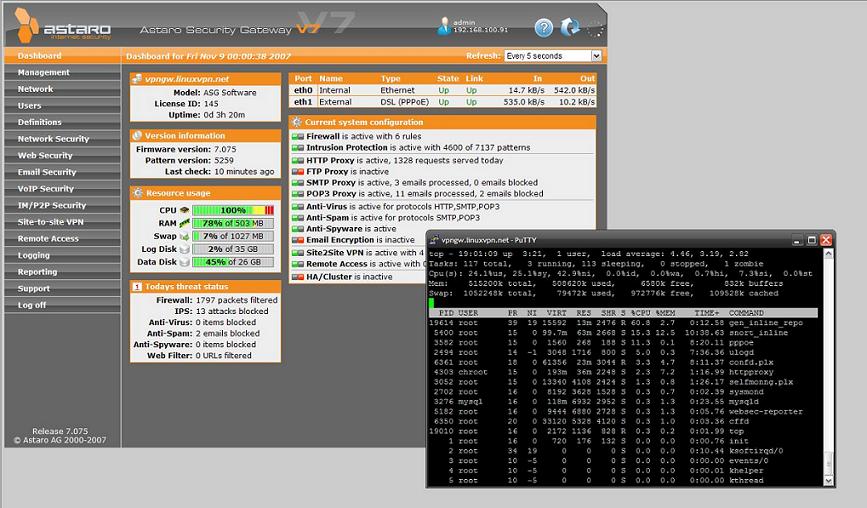
The Dashboard is reporting 100% CPU, 78% RAM, 7% SWAP.
However running top via SSH, shows the cpu running around 50%, and RAM is nearly 100%, however some is cached.
See the attached screenshot.
