Guest User!

You are not Sophos Staff.

This discussion has been locked.
You can no longer post new replies to this discussion. If you have a question you can start a new discussion

High bandwith consumption in bridge mode and high latency

Greetings,

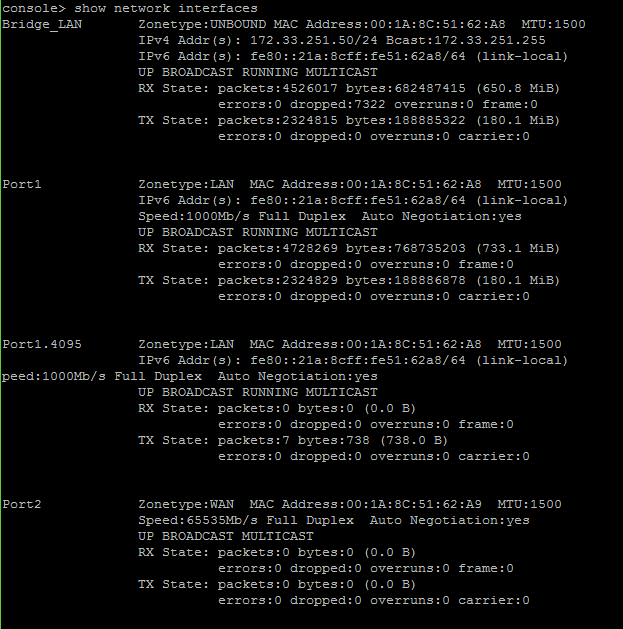
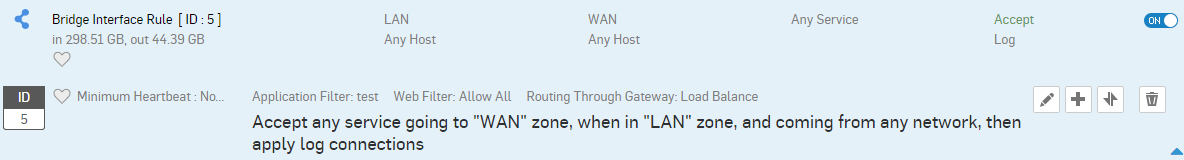
I’ve installed a Sophos XG210 in bridge mode, with a cisco ASA in the perimeter connected to WAN link, and a cisco core switch in the LAN link.

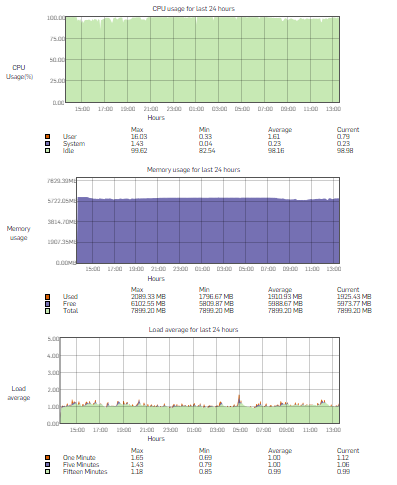
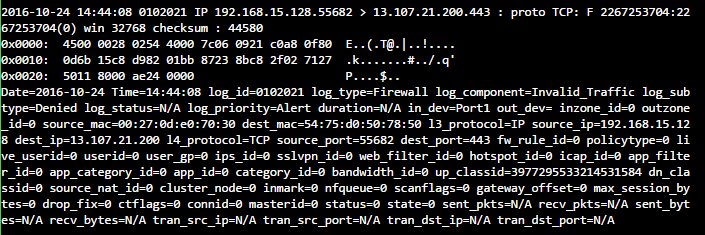
When the Sophos XG is connected, every time a High consumption of bandwidth (due to updates or something else), the internet connection goes south, with high latency and intermittence. The resources (CPU - RAM) in Sophos XG stays normal. This problem isn’t happening if the Sophos XG is disconnected from the network.

In other implementations, when Fortigate is above (instead of Cisco ASA), it doesn't happens.

Have anyone experience this issue?

Regards,

Jose


This thread was automatically locked due to age.
Parents
  • Hi Jose,

    That is strange, do you see any dropped or error packets on the interface?

    Take SSH to XG and go to option 4. Device console.

    Execute, show network interfaces. Post the output.

    Thanks

  • Thanks Aditya and Sachin for your answers.

    The updates I was referring are windows updates and other high consumption bandwidth apps (in the LAN side).

    Sachin, the output of the command shows:

    As you can see, there is dropped packages on the Bridge interface. Today we are going to configure the physical interfaces from autonegotiation to 1000 Mbps Full Duplex, in the Sophos XG and in the Cisco ASA, and Switch Core.

    Do you have any other recomendation that I could applied?

    Thanks again for all your help.

    Regards,

    Jose

  • Hi Sachin,

    thanks again for your answer. However, I checked the patch cords, which were freshly opened for the deployment. Besides, this client has two branches with same configuration, and in both locations are experience the same issue.

    let me know if there is another workaround.

    Regards,

    Jose

  • Hi Jose, 

    If the Bandwidth utilization is high due to Windows Update , I would recommend you to apply QOS on application "BITS" under application filter and Enable QOS for Application filtering on the Firewall rules. Also the value you insert is in KB so 128KBPS=1mbps bandwidth.

    This would enable te updates to pass through  XG appliance with Specified Bandwidth so it would not hamper your network when all systems updates simultaneously.

    Thanks and Regards

    Aditya Patel 

  • Jose,

    make sure to configure Speed on both Switch and XG side. Also can you share output from the following commands:

    netstat -s

    ethtool -S "portname"

    You should execute these commands from CLI > Option 5 > Option 3

    Thanks

  • Hi Luk,

    thanks for your reply. The Sophos XG is only connected to the LAN port of the bridge, and is not handling any traffic, so I hope this commands shows historic events:

    netstat -s output:

    XG210_WP02_SFOS 15.01.0 MR-3# netstat -s
    Ip:
    0 total packets received
    0 forwarded
    0 incoming packets discarded
    3936584 incoming packets delivered
    5784012 requests sent out
    100 dropped because of missing route
    560 reassemblies required
    280 packets reassembled ok
    Icmp:
    24566 ICMP messages received
    199 input ICMP message failed.
    InCsumErrors: 0
    ICMP input histogram:
    destination unreachable: 6282
    timeout in transit: 2
    echo requests: 1400
    echo replies: 16882
    24493 ICMP messages sent
    0 ICMP messages failed
    ICMP output histogram:
    destination unreachable: 6188
    echo request: 16905
    echo replies: 1400
    IcmpMsg:
    InType0: 16882
    InType3: 6282
    InType8: 1400
    InType11: 2
    OutType0: 1400
    OutType3: 6188
    OutType8: 16905
    Tcp:
    101521 active connections openings
    84699 passive connection openings
    382 failed connection attempts
    1074 connection resets received
    201 connections established
    2172208 segments received
    2196522 segments send out
    12106 segments retransmited
    6 bad segments received.
    24868 resets sent
    InCsumErrors: 0
    Udp:
    1696223 packets received
    5563 packets to unknown port received.
    32977 packet receive errors
    3547019 packets sent
    RcvbufErrors: 4212
    SndbufErrors: 0
    InCsumErrors: 0
    UdpLite:
    InDatagrams: 0
    NoPorts: 0
    InErrors: 0
    OutDatagrams: 0
    RcvbufErrors: 0
    SndbufErrors: 0
    InCsumErrors: 0
    error parsing /proc/net/snmp: Success

    ethtool Output:

    XG210_WP02_SFOS 15.01.0 MR-3# ethtool -S Bridge_LAN
    no stats available
    XG210_WP02_SFOS 15.01.0 MR-3# ethtool -S Port1
    NIC statistics:
    rx_packets: 4794509
    tx_packets: 2335180
    rx_bytes: 810968783
    tx_bytes: 202218405
    rx_broadcast: 550328
    tx_broadcast: 5078
    rx_multicast: 3222889
    tx_multicast: 21
    multicast: 3222889
    collisions: 0
    rx_crc_errors: 0
    rx_no_buffer_count: 0
    rx_missed_errors: 0
    tx_aborted_errors: 0
    tx_carrier_errors: 0
    tx_window_errors: 0
    tx_abort_late_coll: 0
    tx_deferred_ok: 0
    tx_single_coll_ok: 0
    tx_multi_coll_ok: 0
    tx_timeout_count: 0
    rx_long_length_errors: 0
    rx_short_length_errors: 0
    rx_align_errors: 0
    tx_tcp_seg_good: 0
    tx_tcp_seg_failed: 0
    rx_flow_control_xon: 0
    rx_flow_control_xoff: 0
    tx_flow_control_xon: 0
    tx_flow_control_xoff: 0
    rx_long_byte_count: 810968783
    tx_dma_out_of_sync: 0
    tx_smbus: 0
    rx_smbus: 0
    dropped_smbus: 0
    os2bmc_rx_by_bmc: 0
    os2bmc_tx_by_bmc: 0
    os2bmc_tx_by_host: 0
    os2bmc_rx_by_host: 0
    tx_hwtstamp_timeouts: 0
    rx_hwtstamp_cleared: 0
    rx_errors: 0
    tx_errors: 0
    tx_dropped: 0
    rx_length_errors: 0
    rx_over_errors: 0
    rx_frame_errors: 0
    rx_fifo_errors: 0
    tx_fifo_errors: 0
    tx_heartbeat_errors: 0
    tx_queue_0_packets: 776457
    tx_queue_0_bytes: 58987356
    tx_queue_0_restart: 0
    tx_queue_1_packets: 1558723
    tx_queue_1_bytes: 132022413
    tx_queue_1_restart: 0
    rx_queue_0_packets: 3851276
    rx_queue_0_bytes: 493450618
    rx_queue_0_drops: 0
    rx_queue_0_csum_err: 1
    rx_queue_0_alloc_failed: 0
    rx_queue_1_packets: 943233
    rx_queue_1_bytes: 285533749
    rx_queue_1_drops: 0
    rx_queue_1_csum_err: 5
    rx_queue_1_alloc_failed: 0
    XG210_WP02_SFOS 15.01.0 MR-3# ethtool -S Port2
    NIC statistics:
    rx_packets: 0
    tx_packets: 0
    rx_bytes: 0
    tx_bytes: 0
    rx_broadcast: 0
    tx_broadcast: 0
    rx_multicast: 0
    tx_multicast: 0
    multicast: 0
    collisions: 0
    rx_crc_errors: 0
    rx_no_buffer_count: 0
    rx_missed_errors: 0
    tx_aborted_errors: 0
    tx_carrier_errors: 0
    tx_window_errors: 0
    tx_abort_late_coll: 0
    tx_deferred_ok: 0
    tx_single_coll_ok: 0
    tx_multi_coll_ok: 0
    tx_timeout_count: 0
    rx_long_length_errors: 0
    rx_short_length_errors: 0
    rx_align_errors: 0
    tx_tcp_seg_good: 0
    tx_tcp_seg_failed: 0
    rx_flow_control_xon: 0
    rx_flow_control_xoff: 0
    tx_flow_control_xon: 0
    tx_flow_control_xoff: 0
    rx_long_byte_count: 0
    tx_dma_out_of_sync: 0
    tx_smbus: 0
    rx_smbus: 0
    dropped_smbus: 0
    os2bmc_rx_by_bmc: 0
    os2bmc_tx_by_bmc: 0
    os2bmc_tx_by_host: 0
    os2bmc_rx_by_host: 0
    tx_hwtstamp_timeouts: 0
    rx_hwtstamp_cleared: 0
    rx_errors: 0
    tx_errors: 0
    tx_dropped: 0
    rx_length_errors: 0
    rx_over_errors: 0
    rx_frame_errors: 0
    rx_fifo_errors: 0
    tx_fifo_errors: 0
    tx_heartbeat_errors: 0
    tx_queue_0_packets: 0
    tx_queue_0_bytes: 0
    tx_queue_0_restart: 0
    tx_queue_1_packets: 0
    tx_queue_1_bytes: 0
    tx_queue_1_restart: 0
    rx_queue_0_packets: 0
    rx_queue_0_bytes: 0
    rx_queue_0_drops: 0
    rx_queue_0_csum_err: 0
    rx_queue_0_alloc_failed: 0
    rx_queue_1_packets: 0
    rx_queue_1_bytes: 0
    rx_queue_1_drops: 0
    rx_queue_1_csum_err: 0
    rx_queue_1_alloc_failed: 0


    Thanks for all your help!


    Jose

  •  Hello again,


    I've connected the Sophos XG to the Bridge, and managed to get the commands on production state. After applying the fixed speed, the issue is still happening:


    console> show network interfaces
    Bridge_LAN Zonetype:UNBOUND MAC Address:00:1A:8C:51:8A:08 MTU:1500
    IPv4 Addr(s): 172.16.1.3/29 Bcast:172.16.1.7
    IPv6 Addr(s): fe80::21a:8cff:fe51:8a08/64 (link-local)
    UP BROADCAST RUNNING MULTICAST
    RX State: packets:468893970 bytes:392817535575 (365.8 GiB)
    errors:0 dropped:1370 overruns:0 frame:0
    TX State: packets:475980078 bytes:313076385621 (291.5 GiB)
    errors:0 dropped:0 overruns:0 carrier:0


    Port1 Zonetype:LAN MAC Address:00:1A:8C:51:8A:08 MTU:1500
    IPv6 Addr(s): fe80::21a:8cff:fe51:8a08/64 (link-local)
    Speed:1000Mb/s Full Duplex Auto Negotiation:yes
    UP BROADCAST RUNNING MULTICAST
    RX State: packets:326663262 bytes:127449718446 (118.6 GiB)
    errors:0 dropped:9 overruns:304294600 frame:0
    TX State: packets:398203001 bytes:357424995732 (332.8 GiB)
    errors:0 dropped:0 overruns:0 carrier:0


    Port1.4095 Zonetype:LAN MAC Address:00:1A:8C:51:8A:08 MTU:1500
    IPv6 Addr(s): fe80::21a:8cff:fe51:8a08/64 (link-local)
    peed:1000Mb/s Full Duplex Auto Negotiation:yes
    UP BROADCAST RUNNING MULTICAST
    RX State: packets:0 bytes:0 (0.0 B)
    errors:0 dropped:0 overruns:0 frame:0
    TX State: packets:7 bytes:738 (738.0 B)
    errors:0 dropped:0 overruns:0 carrier:0


    Port2 Zonetype:WAN MAC Address:00:1A:8C:51:8A:09 MTU:1500
    IPv6 Addr(s): fe80::21a:8cff:fe51:8a09/64 (link-local)
    peed:1000Mb/s Full Duplex Auto Negotiation:yes
    UP BROADCAST RUNNING MULTICAST
    RX State: packets:439759585 bytes:446119713527 (415.4 GiB)
    errors:0 dropped:0 overruns:264143088 frame:0
    TX State: packets:388091890 bytes:130658151528 (121.6 GiB)
    errors:0 dropped:0 overruns:0 carrier:0


    Port2.4095 Zonetype:WAN MAC Address:00:1A:8C:51:8A:09 MTU:1500
    IPv6 Addr(s): fe80::21a:8cff:fe51:8a09/64 (link-local)
    peed:1000Mb/s Full Duplex Auto Negotiation:yes
    UP BROADCAST RUNNING MULTICAST
    RX State: packets:0 bytes:0 (0.0 B)
    errors:0 dropped:0 overruns:0 frame:0
    TX State: packets:7 bytes:738 (738.0 B)
    errors:0 dropped:0 overruns:0 carrier:0

    XG210_WP02_SFOS 15.01.0 MR-3# ethtool -S Port1
    NIC statistics:
    rx_packets: 326806982
    tx_packets: 398446281
    rx_bytes: 130023448747
    tx_bytes: 360826530798
    rx_broadcast: 1551018
    tx_broadcast: 1332185
    rx_multicast: 14938213
    tx_multicast: 10693
    multicast: 14938213
    collisions: 0
    rx_crc_errors: 0
    rx_no_buffer_count: 0
    rx_missed_errors: 0
    tx_aborted_errors: 0
    tx_carrier_errors: 0
    tx_window_errors: 0
    tx_abort_late_coll: 0
    tx_deferred_ok: 0
    tx_single_coll_ok: 0
    tx_multi_coll_ok: 0
    tx_timeout_count: 8
    rx_long_length_errors: 0
    rx_short_length_errors: 0
    rx_align_errors: 0
    tx_tcp_seg_good: 0
    tx_tcp_seg_failed: 0
    rx_flow_control_xon: 0
    rx_flow_control_xoff: 0
    tx_flow_control_xon: 0
    tx_flow_control_xoff: 0
    rx_long_byte_count: 130023448747
    tx_dma_out_of_sync: 0
    tx_smbus: 0
    rx_smbus: 0
    dropped_smbus: 0
    os2bmc_rx_by_bmc: 0
    os2bmc_tx_by_bmc: 0
    os2bmc_tx_by_host: 0
    os2bmc_rx_by_host: 0
    tx_hwtstamp_timeouts: 0
    rx_hwtstamp_cleared: 0
    rx_errors: 0
    tx_errors: 0
    tx_dropped: 0
    rx_length_errors: 0
    rx_over_errors: 0
    rx_frame_errors: 0
    rx_fifo_errors: 304294600
    tx_fifo_errors: 0
    tx_heartbeat_errors: 0
    tx_queue_0_packets: 71189423
    tx_queue_0_bytes: 76625644605
    tx_queue_0_restart: 0
    tx_queue_1_packets: 327260696
    tx_queue_1_bytes: 281003430295
    tx_queue_1_restart: 0
    rx_queue_0_packets: 151618006
    rx_queue_0_bytes: 55971457089
    rx_queue_0_drops: 137924835
    rx_queue_0_csum_err: 45
    rx_queue_0_alloc_failed: 0
    rx_queue_1_packets: 175191061
    rx_queue_1_bytes: 71509904861
    rx_queue_1_drops: 166369765
    rx_queue_1_csum_err: 14
    rx_queue_1_alloc_failed: 0


    XG210_WP02_SFOS 15.01.0 MR-3# ethtool -S Port2
    NIC statistics:
    rx_packets: 440053260
    tx_packets: 388302942
    rx_bytes: 449831128962
    tx_bytes: 134031575147
    rx_broadcast: 1160146
    tx_broadcast: 1468531
    rx_multicast: 10673
    tx_multicast: 14040840
    multicast: 10673
    collisions: 0
    rx_crc_errors: 0
    rx_no_buffer_count: 0
    rx_missed_errors: 0
    tx_aborted_errors: 0
    tx_carrier_errors: 0
    tx_window_errors: 0
    tx_abort_late_coll: 0
    tx_deferred_ok: 256836
    tx_single_coll_ok: 0
    tx_multi_coll_ok: 0
    tx_timeout_count: 3
    rx_long_length_errors: 0
    rx_short_length_errors: 0
    rx_align_errors: 0
    tx_tcp_seg_good: 0
    tx_tcp_seg_failed: 0
    rx_flow_control_xon: 553141
    rx_flow_control_xoff: 971217
    tx_flow_control_xon: 0
    tx_flow_control_xoff: 0
    rx_long_byte_count: 449831128962
    tx_dma_out_of_sync: 0
    tx_smbus: 0
    rx_smbus: 0
    dropped_smbus: 0
    os2bmc_rx_by_bmc: 0
    os2bmc_tx_by_bmc: 0
    os2bmc_tx_by_host: 0
    os2bmc_rx_by_host: 0
    tx_hwtstamp_timeouts: 0
    rx_hwtstamp_cleared: 0
    rx_errors: 0
    tx_errors: 0
    tx_dropped: 0
    rx_length_errors: 0
    rx_over_errors: 0
    rx_frame_errors: 0
    rx_fifo_errors: 264143088
    tx_fifo_errors: 0
    tx_heartbeat_errors: 0
    tx_queue_0_packets: 13231709
    tx_queue_0_bytes: 5257628889
    tx_queue_0_restart: 0
    tx_queue_1_packets: 375074542
    tx_queue_1_bytes: 125440529004
    tx_queue_1_restart: 0
    rx_queue_0_packets: 225874311
    rx_queue_0_bytes: 228188636332
    rx_queue_0_drops: 111393676
    rx_queue_0_csum_err: 21
    rx_queue_0_alloc_failed: 0
    rx_queue_1_packets: 214182721
    rx_queue_1_bytes: 218229179843
    rx_queue_1_drops: 152749412
    rx_queue_1_csum_err: 23
    rx_queue_1_alloc_failed: 0


    Thanks for all your help.


    Regards,

  • Jose,

    what about CPU/RAM utilization?

    I think you should open a ticket with support. It can be a problem that XG is too small, NIC driver issue or a bug inside the code.

    Let us know!

    Thanks

  • Hi Luk,


     I opened a case with Sophos Support. The graphics of CPU, memory and load for the last 24 hours are:

    The device is an XG210, and there are max, 150 users on network. So it must be another thing.

    Thanks for your reply. I'll keep you posted if we find the solution with Sophos Support.

    Regards,


    Jose

  • Hi again,


    Sophos Support is taking a while so I'll post an update:

    If I execute drop-packet-capture, I get several logs like the next one:

    But I have a policy that match that packet and is not let it through the XG:

    The ISP service is OFF. What else could cause this problem?


    Regards,


    Jose

  • proto TCP:F will be logged as dropped as FIN/RST packets are not affected by ALLOW ALL rules. Without quality logging, I am afraid you will have to wait on support [:(]

    I am curious about your setup. Are you inspecting any traffic on XG or just routing all traffic? What are your other firewall rules?

  • Hi Billy,

    I'm using the XG for Spam Filter and ATP mainly. After the issue being solved, we will configure some Web filter policies.

    What could be the cause for the Sophos XG to read those packages as proto TCP:F? they have a Cisco Switch core before the XG (LAN side) and Cisco ASA after (WAN side).

    What logs do you want to see?, if it's not much trouble.

    Thanks for all your help.

    Regards,

    Jose

Reply
  • Hi Billy,

    I'm using the XG for Spam Filter and ATP mainly. After the issue being solved, we will configure some Web filter policies.

    What could be the cause for the Sophos XG to read those packages as proto TCP:F? they have a Cisco Switch core before the XG (LAN side) and Cisco ASA after (WAN side).

    What logs do you want to see?, if it's not much trouble.

    Thanks for all your help.

    Regards,

    Jose

Children
No Data