Guest User!

You are not Sophos Staff.

This discussion has been locked.
You can no longer post new replies to this discussion. If you have a question you can start a new discussion

XG 19 SD WAN Application timeout

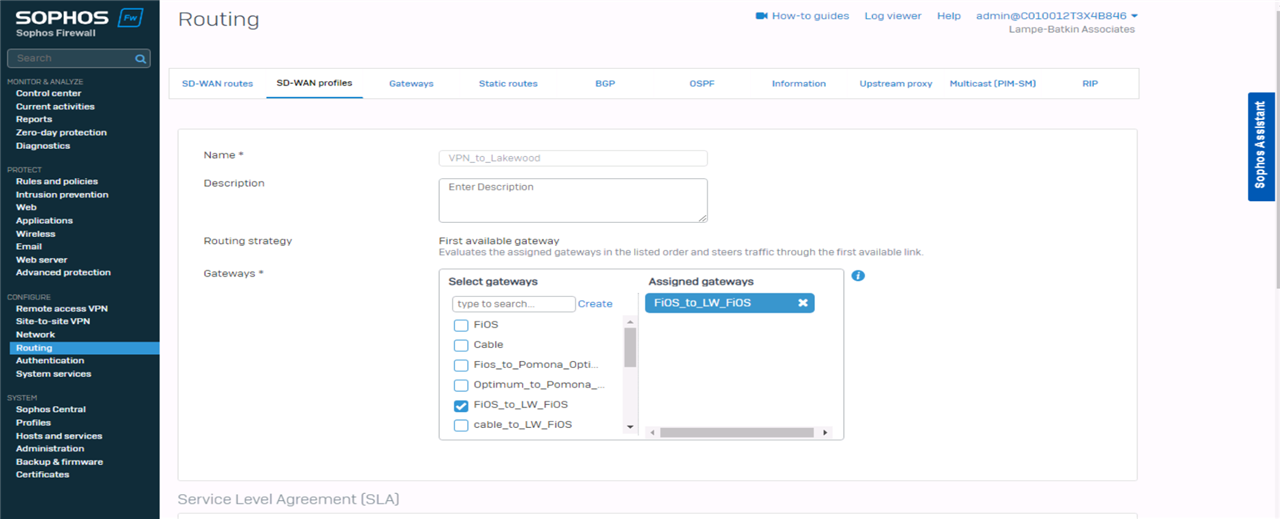
I have XG V19 Firewalls and created a SD-WAN policy to handle traffic for Site 2 Site Route based IPSec VPN with xfrm interfaces.

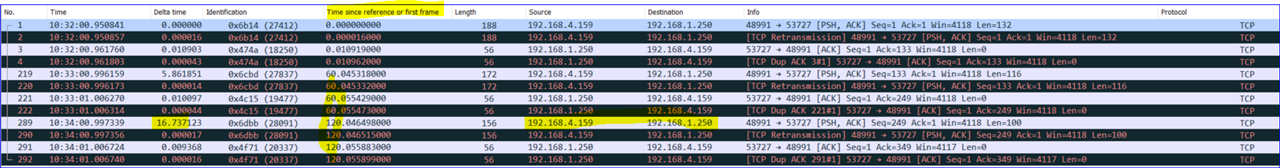
it works great, just some strange issue, many application that are used over that VPN timeout and crash after around 15 - 20 minutes,

so if a user has open an RDP session it will suddenly crash


This thread was automatically locked due to age.
Parents
  • Here 10.21.11.1 is that the gateway or private DNS ?

    also can you reduce the sample size for sample size for sla to 5...

  • Hello ,

    Thank you for providing the packet captures...
    Upon looking at the Conntrack captured we are able to see the initial tcp handshake:

    =============
    But it looks like while capturing the pcap file, the packet capture was started late and hence it did not capture the initial tcp-handshake and just data packets were captured:


    Looks like there is a latency on either side especially when the packets coming from 4.159...
    As you notice the delta time, the packet response almost took 16s to reply and if you noticed the time reference, the packet took 120s, i.e. 2 mins, so if the server side has request time out set to 2 mins, there are chances the session may disconnect. 

    You can compare this non-working scenario with the working scenario with the packet capture and try to diagnose whether or not latency occurs or not ? With the help of wireshark on either sides. 

    Based on that whatever the packet loss or re-transmission or dup-ack from the server side, you can fine tune the timeout settings on the server side with the help of your server team. 

    Additionally, on the Advance firewall settings you can toggle the following to see if that helps in improving the situation: 
    You can check the status by logging with the admin credential via putty by SSH protocol > press 4 for the device console: 

    console> show advanced-firewall
    ===============================

    And the try toggling the following:
    1.) Midstream Connection Pickup
    2.)  TCP Seq Checking
    3.)  TCP Window Scaling
    4.)  TCP Selective Acknowledgements 

    Commands can be found here along with the explanation: https://docs.sophos.com/nsg/sophos-firewall/18.5/Help/en-us/webhelp/onlinehelp/CommandLineHelp/DeviceConsole/Set/index.html


  • This is a definitely a behaviour since upgrade to v19. as I have the same issues on another sites that worked perfectly fine till v19

    not sure what my next step should be, as I am not an expert in fine tuning advanced TCP settings

  • Your Dump does not include the entire connection. 

    So it is missing the handshake (connection establishment) and the timeout. 

    But from a perspective of SD-WAN and conntrack, this looks fine. It matches to SD-wan rule 11 and it moves the traffic to xfrm10 interface. 

    But in one of your plain text dumps: 

    01:10:39.264263 PortA, IN: In 00:50:56:90:7d:14 ethertype IPv4 (0x0800), length 1416: 192.168.1.250.53727 > 192.168.4.159.48991: Flags [P.], seq 5801:7161, ack 111552, win 4117, length 1360
    01:10:39.264300 xfrm10, OUT: Out ethertype IPv4 (0x0800), length 1416: 192.168.1.250.53727 > 192.168.4.159.48991: Flags [P.], seq 5801:7161, ack 111552, win 4117, length 1360
    01:10:45.392532 PortA, IN: In 00:50:56:90:7d:14 ethertype IPv4 (0x0800), length 56: 192.168.1.250.53727 > 192.168.4.159.48991: Flags [R.W], seq 7161, ack 111552, win 0, length 0
    01:10:45.392566 xfrm10, OUT: Out ethertype IPv4 (0x0800), length 56: 192.168.1.250.53727 > 192.168.4.159.48991: Flags [R.W], seq 7161, ack 111552, win 0, length 0

    Basically this means, the connection is there, both are talking and the 192.168.1.250 decides to close the connection for what ever reason. R.W means basically to reset (close the connection). 

    That looks odd to me, as this connection is healthy and gets closed by the client for some reason. 

    There seems to be a huge timeout after some time: 

    Basically this is the last packet coming from the peer: 

    01:04:00.997339 xfrm10, IN:  In ethertype IPv4 (0x0800), length 156: 192.168.4.159.48991 > 192.168.1.250.53727: Flags [P.], seq 111452:111552, ack 5801, win 4118, length 100

    After this, the client is sending 6 minutes data but no respond from the peer anymore. It is push/ack, which means, no respond needed but there could be the timeout. 

    I would recommend to look at the peer at this point. Because why is actually no packets arriving for 6 minutes? 

  • the application i tested with is Radmin viewer to Radmin server.

    i started a session and let it go.

    with v18 it never dropped. and this is not the only application I see it happening.

    I have upgraded 2 firewalls in another site to V19 and the exact same drop / disconnect happens.

  • What about the other peer? We are currently looking at one end. 

  • both peers are updated to V19

  • Can you give the same data like above from the other appliance as well? Maybe do the same processes on both appliances. 

  • what's the command to run tcpdump on port 48991 and have it write to a file ?

    the above command stops writing to the file after a certain amount of bytes captured

  • Hey ,

    You can use the following syntax in the advance shell: 
    > To capture the tcpdump: tcpdump -nei any port 48991

    >To capture pcap: tcpdump -nei any port 48991 -s0 -b -w /var/<name.pcap> 

    KBA1: https://support.sophos.com/support/s/article/KB-000037007?language=en_US

    KBA2: https://support.sophos.com/support/s/article/KB-000042152?language=en_US

Reply Children