Guest User!

You are not Sophos Staff.

This discussion has been locked.
You can no longer post new replies to this discussion. If you have a question you can start a new discussion

How to log Drops from advanced-firewall checks

Hello,

We have a clients-server based application, where the server is in a different vlan as the clients.

The communication between both vlans is routed via SophosXG VLAN Interfaces. (XG430 / 18.5MR1)

The GUI firewall rules are configured to allow everything for both vlan-networks in each direction.

However, this client-server based application doesn't work with this setup.

Only way to get the application working as expected is to set advanced-firewall bypass via CLI

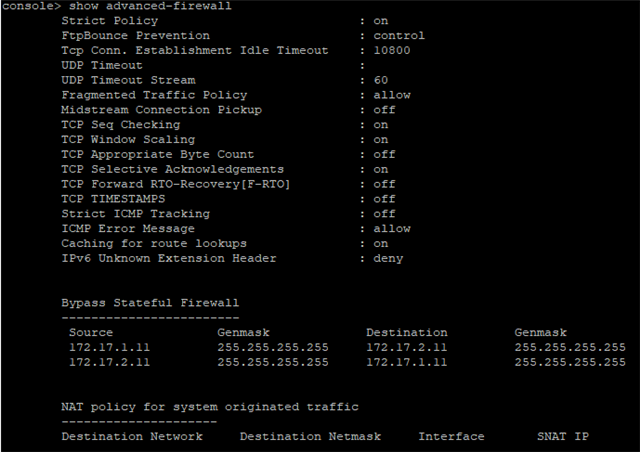
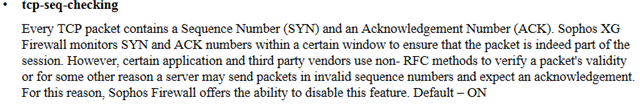
I assume that the application is not working 100% RFC conform and for example the XG tcp-seq-checking drops the packege.

My problem is, I cant see any dropped packeg in any log on XG firewall.

I need to know exactly why the firewall is dropping that traffic in order to contact the application vendors if something is not RFC compliant at application side.

Can you please tell me how to log such kind of drops from the advanced-firewall checks.

Thank you for help!


This thread was automatically locked due to age.
Parents
  • Hi,

    using logviewer refine your search to the server's IP address to see where the traffic might be  going?

    Ian

  • I already filtered the GUI LogViewer for source/destination and cant see any problem relaited logs entries.

    No invalid traffic or something like that.

    I tried to enable all Log-Options in SystemServices -> LogSettings -> Local Reporting but still no log entry while reproducting the problem.

  • With all the tests we have done so far, for me it looks like that this ATP/AC module is dropping the traffic because once i create "set ips ac_atp exception fwrules 6" everything works fine.

    Can you confirm this? If not can you please explain why you think we should search the problem on an other place like asymmetrical routing issues because I dont understand this at the moment.

    Do you know if it is possible to log this drops from ATP/AC module or if these kind of drops are silent?

  • Do you have micro app enabled? 

    console> system application_classification show
    On
    console> system application_classification microapp-discovery
    off on show
    console> system application_classification microapp-discovery show
    off

  • No this is not enabled:

    console> system application_classification show
    On

    console> system application_classification microapp-discovery show
    off

  • Sorry to bother you again.

    Could you please answer me the question, if there is any possibility to log this drops from ATP/AC module or if these kind of drops are silent?

  • Its the atp.log or drop packet capture. If there are no drops, this is not dropped. 

  • where can I find atp.log?

    There is no atp.log in /log Folder

    XG430_WP02_SFOS 18.5.1 MR-1-Build326# cd /log/
    XG430_WP02_SFOS 18.5.1 MR-1-Build326# ls
    VPN.log                     catUpdateLog                dnsd.log                    garner.log                  migration.log               readobject.log              red-R20002F2VQCJR37.log     smtpd_panic.log             up2date_av.log
    WINGc.log                   centralmanagement.log       dnsgrabber.log              garner.log.0                migrationhash.log           red                         red-R20002MHTCCCR28.log     snireport.log               validation.log
    WINGc.log.0                 centralmanagement.log.0     dnsgrabber.log.0            ha_pair.log                 mrouting.log                red-A35019622135F65.log     red.log                     snmpd.log                   validationError.log
    access_server.log           charon.log                  dropbear.log                ha_tunnel.log               msync.log                   red-A350199D5868BE5.log     redis                       sophos-central.log          validationError.log.0
    apache.log                  charon.log.0                eacd.log                    hbtrust.log                 msync.log.0                 red-A3501B9B893500C.log     reportdb.log                sshd.log                    vhost.log
    apache_access.log           chromebook-sso-backend.log  entity.log                  hbtrust.log.0               nSXLd                       red-A3501D2BEF22F74.log     reportmigration.log         sslvpn.log                  vpncertificate.log
    apache_access.log.0         clientless_access.log       error_log.log               heartbeatd.log              nSXLd.log                   red-A3501DA8C271A54.log     reverseproxy.log            ssod.log                    warren.log
    apiparser.log               confdbstatus.log            exim_mail_client.log        hostapd.log                 nasm.log                    red-A3501E4B83A55E1.log     reverseproxy.log.0          strongswan-monitor.log      wc_remote.log
    app-feedback.log            crreportdb.log              firewall_rule.log           hotspotd.log                nat_rule.log                red-A3501E58921CF3D.log     ripd.log                    strongswan.log              webproxy.log
    appcached.log               csc.log                     fqdnd.log                   httplogd.log                networkd.log                red-A3501E77570D8E8.log     sac-feedback.log            strongswan.log.0            wifiauth.log
    applog.log                  csc.log.0                   fqdnd.log.0                 hwmon.log                   networkd.log.0              red-A3501F696540315.log     sandbox_reportd.log         sync.log                    xfrmi.log
    applog.log.0                cschelper.log               fqdndebug.log               ips.log                     npu-startup.log.prev        red-A350232E7D3581D.log     sandboxd.log                sysinit.log                 xgs-healthmond.log
    av.log                      csd.log                     ftpproxy.log                ipsec.log                   npu_syslog.log              red-A36020093C07EDC.log     sessiontbl.log              syslog-ng.log               xgs-host.log
    avd.log                     ctasd.log                   fwcm-eventd.log             ipsec_conn                  ntpclient.log               red-R200018963CFXC8.log     sig_upgrade.log             syslog.log                  xgs-npu-fw.log
    avd.log.0                   ctipd.log                   fwcm-eventd.log.0           ipsec_monitor.log           openvpn-status.log          red-R20001HKPXRMJE7.log     sigdb.log                   tlsreport.log               zebra.log
    awarrenhttp.log             ctsyncd.log                 fwcm-heartbeatd.log         iview.log                   ospfd.log                   red-R20001T9YFQK700.log     sigmigration.log            tmclient.log
    awarrenhttp_access.log      ddc.log                     fwcm-heartbeatd.log.0       iview.log.0                 pimd.log                    red-R20001YCCYYJR6D.log     skein.log                   tomcat.log
    awarrensmtp.log             dgd.log                     fwcm-updaterd.log           l2tpd.log                   pktcapd.log                 red-R20001YJGKMDW95.log     smbnetfs.log                tomcat.log.0
    awed.log                    dgd.log.0                   fwcm-updaterd.log.0         lcd.log                     postgres.log                red-R20001YJRF8T4CF.log     smtpd_error.log             u2d.log
    bgpd.log                    dhcpd.log                   fwlog.log                   licensing.log               pptpvpn.log                 red-R200024FYJ9R403.log     smtpd_main.log              u2d.log.0
    bwm.log                     dhcpd6.log                  fwmgmt.log                  mdev.log                    radvd.log                   red-R200029YG4GHCC8.log     smtpd_main.log.0            uma.log
    XG430_WP02_SFOS 18.5.1 MR-1-Build326#
    

  • dropped packet capture does not show one line while reproducing the error.

    ips.log is filling up with some entries constantly, but I can not see any relationship to my problem because the entries are written every 20-30 sec regardless if I reproduce the error or not.

    1637221271.445212946 [12491/0xeb0000007485] [nsg_tcphold.c:315:process_event] Could not find session for key and unique_id.
    1637221271.648529883 [12491/0xc11400003517] [nsg_tcphold.c:315:process_event] Could not find session for key and unique_id.
    1637221281.576054732 [12492/0x4e4000008260] [nsg_tcphold.c:315:process_event] Could not find session for key and unique_id.
    1637221296.315486715 [12491/0x73e700005f7a] [nsg_tcphold.c:315:process_event] Could not find session for key and unique_id.
    1637221361.592918676 [12491/0xe1b6000013a8] [nsg_tcphold.c:315:process_event] Could not find session for key and unique_id.
    1637221372.286165496 [12491/0xfbf00000a67f] [nsg_tcphold.c:315:process_event] Could not find session for key and unique_id.
    1637221376.254997289 [12489/0x1a71000bf215] [nsg.c:1037:parser_context_req_begin_cb] Cannot parse pipelined request. Will offload traffic. (fsm: 1, paf: 0)
    1637221380.264400346 [12488/0x3fd80003c4ec] [nsg_tcphold.c:315:process_event] Could not find session for key and unique_id.
    1637221380.276489084 [12488/0xfe11000016f6] [nsg_tcphold.c:315:process_event] Could not find session for key and unique_id.
    1637221456.394740671 [12491/0xd2da000009c7] [nsg.c:1407:parser_context_resp_eoh_cb] request_fsm_response_begin failed.
    1637221457.111740905 [12489/0x135b000042cf] [nsg.c:1407:parser_context_resp_eoh_cb] request_fsm_response_begin failed.
    1637221461.033688667 [12488/0x4850000de0ea] [nsg_tcphold.c:315:process_event] Could not find session for key and unique_id.
    1637221464.094616417 [12491/0x7019000ddd82] [nsg.c:1407:parser_context_resp_eoh_cb] request_fsm_response_begin failed.
    1637221475.293703382 [12491/0xa403000041aa] [nsg.c:1407:parser_context_resp_eoh_cb] request_fsm_response_begin failed.
    1637221477.222272602 [12492/0x489e000dfdb8] [nsg.c:1407:parser_context_resp_eoh_cb] request_fsm_response_begin failed.
    1637221518.070145981 [12492/0x652300000630] [nsg_tcphold.c:315:process_event] Could not find session for key and unique_id.
    1637221561.813531376 [12491/0xcc0006c25b] [nsg_tcphold.c:315:process_event] Could not find session for key and unique_id.
    1637221562.585277755 [12492/0x5f8000002c00] [nsg_tcphold.c:315:process_event] Could not find session for key and unique_id.
    1637221580.948666411 [12491/0x15a500005097] [nsg_tcphold.c:315:process_event] Could not find session for key and unique_id.
    1637221581.040441116 [12492/0xcb2500013e76] [nsg_tcphold.c:315:process_event] Could not find session for key and unique_id.
    1637221613.689577477 [12492/0x4f9300001625] [nsg_tcphold.c:315:process_event] Could not find session for key and unique_id.
    1637221662.830070946 [12492/0xa0de00008729] [nsg_tcphold.c:315:process_event] Could not find session for key and unique_id.
    1637221722.365829812 [12488/0xcff100004238] [nsg.c:1037:parser_context_req_begin_cb] Cannot parse pipelined request. Will offload traffic. (fsm: 1, paf: 0)
    1637221722.368846499 [12491/0x50a600007ba5] [nsg.c:1037:parser_context_req_begin_cb] Cannot parse pipelined request. Will offload traffic. (fsm: 1, paf: 0)
    1637221722.431311168 [12489/0xcfbf0000423f] [nsg.c:1037:parser_context_req_begin_cb] Cannot parse pipelined request. Will offload traffic. (fsm: 1, paf: 0)
    1637221722.432365908 [12489/0x7c1f00007051] [nsg_tcphold.c:315:process_event] Could not find session for key and unique_id.
    1637221722.433895988 [12491/0x63a80000a747] [nsg.c:1037:parser_context_req_begin_cb] Cannot parse pipelined request. Will offload traffic. (fsm: 1, paf: 0)
    1637221727.362595316 [12491/0x8d2000e47df] [nsg_tcphold.c:315:process_event] Could not find session for key and unique_id.
    1637221828.959235528 [12488/0x109700000984] [nsg_tcphold.c:315:process_event] Could not find session for key and unique_id.
    1637221828.991220647 [12492/0x9ef400006262] [nsg_tcphold.c:315:process_event] Could not find session for key and unique_id.
    1637221834.266318346 [12492/0xf0b00000bd48] [nsg_tcphold.c:315:process_event] Could not find session for key and unique_id.
    1637221834.277881430 [12491/0x31a6000347de] [nsg.c:1037:parser_context_req_begin_cb] Cannot parse pipelined request. Will offload traffic. (fsm: 1, paf: 0)
    1637221834.278348722 [12491/0x15610000102c] [nsg.c:1037:parser_context_req_begin_cb] Cannot parse pipelined request. Will offload traffic. (fsm: 1, paf: 0)
    1637221834.312279944 [12489/0x2166000347d7] [nsg_tcphold.c:315:process_event] Could not find session for key and unique_id.
    1637221834.312504010 [12489/0x66e700004df7] [nsg_tcphold.c:315:process_event] Could not find session for key and unique_id.
    

    You said if it's not logged there it is not dropped.

    But why is the application working when the AC/ATP Exception is active and doesnt work when it is deactivated?

    This indicates that the firewall is dropping that traffic at some point, isnt it?

  • From my perspective, its not about dropping. It looks like the application is intercepted by the proxy. Which means, the connection is not dropped, instead intercepted. If its intercepted, likely the application got dropped by the client/server. 

    A drop would indicate a "retransmission multiple times". But you get from somebody a RST (reset). So somebody wants to kill the connection for what ever reason. 

    BTW: Why is your client getting a 401 unauthorized? 

  • Ok, to follow your theory, do you have any hints where I could search first if this proxy interception took place on XG?

    The firewall rules for internal traffic doesn't have any Webfilter enabled.

    Only firewall rules for internet traffic uses DPI with TLS Decryption, so it should not be relevant for my Problem.

    This 401 unauthorized is a good question, I have seen this in both Traces:

    when the atp_ac rule is disabled -> there is the RST right after the unauthorized

    when the atp_ac rule is enabled -> there is also the same unauthorized message (Access is denied due to invalid Credentials) but the application is working as expected. I can see the next packages in Wireshark Trace are HTTP/XML SOAP packages instead of the RST.

    If it is helpfull, I could send you both Wireshark captures via PN that you can see the difference.

Reply
  • Ok, to follow your theory, do you have any hints where I could search first if this proxy interception took place on XG?

    The firewall rules for internal traffic doesn't have any Webfilter enabled.

    Only firewall rules for internet traffic uses DPI with TLS Decryption, so it should not be relevant for my Problem.

    This 401 unauthorized is a good question, I have seen this in both Traces:

    when the atp_ac rule is disabled -> there is the RST right after the unauthorized

    when the atp_ac rule is enabled -> there is also the same unauthorized message (Access is denied due to invalid Credentials) but the application is working as expected. I can see the next packages in Wireshark Trace are HTTP/XML SOAP packages instead of the RST.

    If it is helpfull, I could send you both Wireshark captures via PN that you can see the difference.

Children
No Data