This discussion has been locked.
You can no longer post new replies to this discussion. If you have a question you can start a new discussion

httpproxy 100% CPU on UTM home 9.200-11

Hi,
I have a new UTM Home version 9.200-11 running on a P4 2.8. with 2 GB RAM.
It's only been running for 3 days and each morning around 6:30 AM httpproxy starts eating 100 percent CPU until I turn off the web proxy and turn it back on again, which could be hours later [;)]

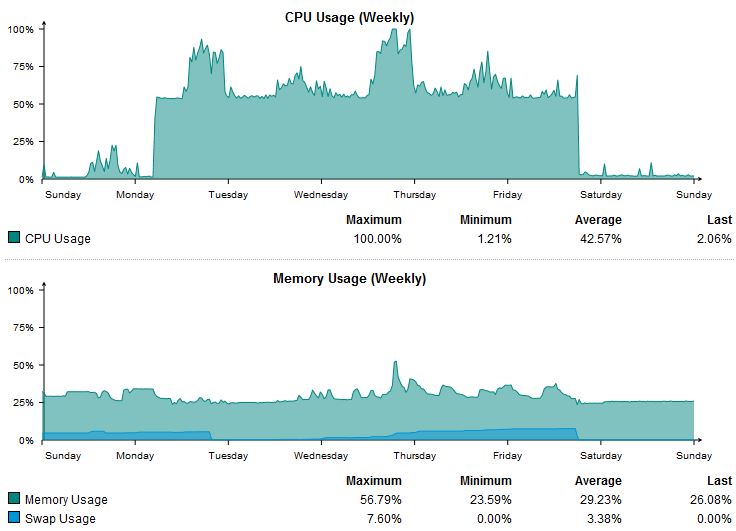
Swap usage has been at 38% and RAM usage has been around 75% during the 100% httpproxy CPU utilization.

I disabled sending suspicious content and caching but that just moved the time to 100% CPU from 6:30 AM to around 8:30 AM.

Web Filtering is running in transparent mode, single engine scan (Sophos) and I have no regex exceptions.

Today around the time of the high CPU utilization I have a bunch of these in the web filtering log:
2014:04:07-08:36:12 fw httpproxy[5076]: id="0003" severity="info" sys="SecureWeb" sub="http" request="(nil)" function="sc_check_servers" file="scr_scanner.c" line="820" message="server 'cffs19.astaro.com' access time: 1299ms"


Where can I look to troubleshoot this?
Thanks for your help with this.


This thread was automatically locked due to age.
Parents
  • Hi Bob,
             It's a rev.5 based UTM 220 with (an unsupported) 8GB of memory.  Httpproxy was using 114% CPU (I'm guessing this is linux's way of showing dual-core use?) but only a fraction of the memory.  Cssd is using next to nothing.  I'll have to contact Sophos support when I have time.

    Here's the process list with dual scan enabled.  (It was on Saturday morning so the only user/traffic was myself.)

    USER	PID	%CPU	%MEM	VSZ	RSS	TTY	STAT	START	TIME	COMMAND
    810 5677 114 9.9 3696148 8123 44 ? Ssl May05 6 435:00:00 9 /var/chroot-http/usr/bin/httpproxy -f -c /var/chroot-http -u httpp
    wwwrun 2626 3.4 0.9 81492 79280 ? S 11:36 0:06 |   \_ /var/webadmin/webadmin.plx
    root 2629 2.4 0.3 65600 31096 ? S 11:36 0:04 \_ confd [worker[:P]rpc:webadmin]
    root 3034 2 0 0 0 ? Z 11:39 0:00 \_ [confd.plx] 
    snort 4552 1.9 4.6 465540 37620 8 ? S


    The attached picture is of the CPU and memory use over the few days that it was acting up.

    Thanks,
              BP
Reply
  • Hi Bob,
             It's a rev.5 based UTM 220 with (an unsupported) 8GB of memory.  Httpproxy was using 114% CPU (I'm guessing this is linux's way of showing dual-core use?) but only a fraction of the memory.  Cssd is using next to nothing.  I'll have to contact Sophos support when I have time.

    Here's the process list with dual scan enabled.  (It was on Saturday morning so the only user/traffic was myself.)

    USER	PID	%CPU	%MEM	VSZ	RSS	TTY	STAT	START	TIME	COMMAND
    810 5677 114 9.9 3696148 8123 44 ? Ssl May05 6 435:00:00 9 /var/chroot-http/usr/bin/httpproxy -f -c /var/chroot-http -u httpp
    wwwrun 2626 3.4 0.9 81492 79280 ? S 11:36 0:06 |   \_ /var/webadmin/webadmin.plx
    root 2629 2.4 0.3 65600 31096 ? S 11:36 0:04 \_ confd [worker[:P]rpc:webadmin]
    root 3034 2 0 0 0 ? Z 11:39 0:00 \_ [confd.plx] 
    snort 4552 1.9 4.6 465540 37620 8 ? S


    The attached picture is of the CPU and memory use over the few days that it was acting up.

    Thanks,
              BP
Children
No Data