This discussion has been locked.
You can no longer post new replies to this discussion. If you have a question you can start a new discussion

High CPU of httpproxy

Hi everyone,

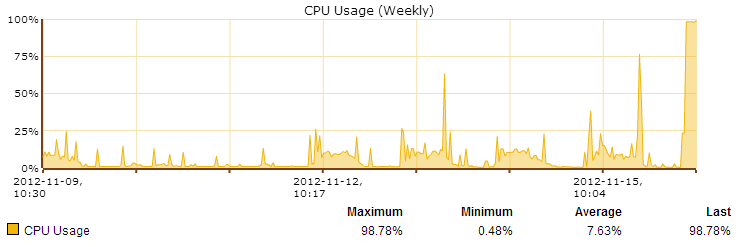
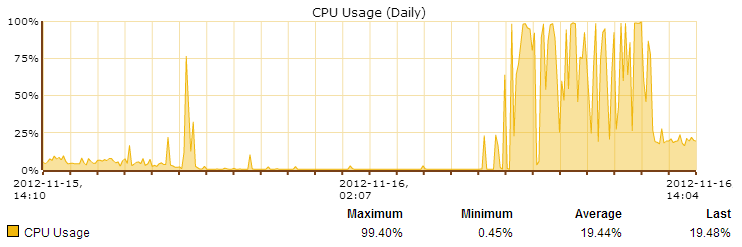
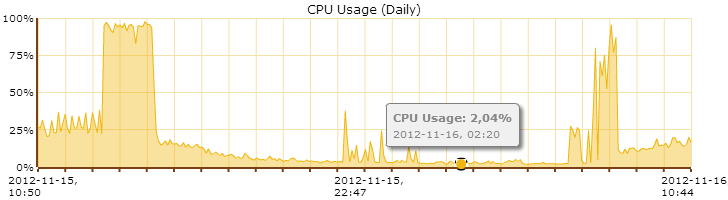
since this morning I have an unusual high CPU usage of my Astaro (v8.306) httpproxy process. I'm not able to determine the cause in any more detail - probably someone else can help.

Shortened top output looks something like this:


top - 10:44:35 up 11 days, 20:26,  1 user,  load average: 1.75, 1.93, 2.18
Tasks: 183 total,   1 running, 180 sleeping,   0 stopped,   2 zombie
Cpu(s): 95.4%us,  1.3%sy,  0.0%ni,  3.1%id,  0.0%wa,  0.1%hi,  0.2%si,  0.0%st
Mem:   4059080k total,  3763964k used,   295116k free,   262636k buffers
Swap:  1052248k total,   134116k used,   918132k free,  1953652k cached

  PID USER      PR  NI  VIRT  RES  SHR S %CPU %MEM    TIME+  COMMAND
29341 httpprox  20   0 1641m 702m  19m S  359 17.7 342:28.76 httpproxy
11184 root      20   0 33556  29m 2344 S   14  0.8   7:23.46 ctmon.plx
10788 wwwrun    20   0 92184  87m 8560 S    7  2.2   5:44.62 index.plx
11185 root      20   0  5452 3176  860 S    3  0.1   2:19.43 cttop
30255 root      20   0 24220  16m 3552 S    1  0.4   3:35.03 websec-reporter
10791 root      20   0 64664  35m 3592 S    1  0.9   2:18.02 confd.plx
10123 postgres  20   0 83124  69m  68m S    1  1.7  68:30.94 postgres
  617 loginuse  20   0  2600 1212  864 R    0  0.0   0:11.57 top
 6585 root      20   0 11744 6120 2252 S    0  0.2  82:51.93 selfmonng.plx
 7248 root      20   0  9204 4968  992 S    0  0.1  11:42.65 named
 7481 root      20   0  7704 3296 1272 S    0  0.1  43:26.28 syslog-ng
 9376 postgres  20   0 83160  69m  68m S    0  1.8  42:44.19 postgres
 9383 root      20   0  5500 2516 1320 S    0  0.1   5:06.48 openvpn
 9482 root      20   0 38432  14m 2296 S    0  0.4   5:16.01 smtpd.bin
 9507 postgres  20   0 82768  69m  68m S    0  1.7   4:12.19 postgres
14523 wwwrun    20   0  7844 3048 2112 S    0  0.1   0:04.46 httpd
    1 root      20   0  1816  544  524 S    0  0.0   0:05.99 init


CPU usage graph has been attached to this post.

Does anyone else have this issue or knows how to dig deeper and find the cause of this sudden rise of activity?

ASG runs on ESXi host with 4 vCPUs and 4 Gigs of RAM. The number of concurrent network connections and traffic is about the same as yesterday and the days before. Configuration has not been changed today.

The only thing I have done is I flushed the Proxy Cache when I noticed the high load.

Regards
Alex


This thread was automatically locked due to age.
  • Since 8306 we have exact the same problem.
  • Restarted http proxy and it looks very normal again...


    top - 12:32:01 up 11 days, 22:14,  1 user,  load average: 1.22, 1.82, 2.59
    Tasks: 183 total,   3 running, 178 sleeping,   0 stopped,   2 zombie
    Cpu(s): 11.7%us,  2.2%sy,  3.2%ni, 81.5%id,  0.8%wa,  0.1%hi,  0.4%si,  0.0%st
    Mem:   4059080k total,  3453596k used,   605484k free,   211080k buffers
    Swap:  1052248k total,   134936k used,   917312k free,  1488588k cached

      PID USER      PR  NI  VIRT  RES  SHR S %CPU %MEM    TIME+  COMMAND
    11184 root      20   0 33556  29m 2344 S   19  0.8  24:25.29 ctmon.plx
    13206 root      39  19 26680  19m 2924 R   13  0.5   0:00.40 gen_inline_repo
    12416 httpprox  20   0 1499m 569m 8468 S   12 14.4   0:27.74 httpproxy
    11185 root      20   0  5916 3752  860 S    7  0.1   7:30.72 cttop
    30255 root      20   0 25492  17m 3552 R    4  0.4   5:52.66 websec-reporter
    11300 root      20   0 67556  38m 3620 S    2  1.0   5:20.47 confd.plx
     7481 root      20   0  7772 3336 1276 S    1  0.1  44:18.57 syslog-ng
     7248 root      20   0  9204 4928 1008 S    1  0.1  11:52.33 named
    10123 postgres  20   0 83212  69m  68m S    1  1.7  69:22.23 postgres
    11299 wwwrun    20   0  163m 155m 2716 S    1  3.9  13:25.72 index.plx
     9376 postgres  20   0 83160  69m  68m S    1  1.8  43:20.43 postgres
    12052 loginuse  20   0  2600 1196  864 R    1  0.0   0:00.69 top
       12 root      20   0     0    0    0 S    0  0.0   5:32.45 events/1
     5319 afcd      19  -1 91156  11m 2504 S    0  0.3  18:09.20 afcd
     6544 root      19  -1  5524 2704  748 S    0  0.1  23:05.86 ulogd
     6585 root      20   0 11744 6768 2268 S    0  0.2  83:17.05 selfmonng.plx
     6940 root      15  -5  8872 4852  412 S    0  0.1  26:50.89 conntrackd
     8399 root      39  19  8260 1936 1120 S    0  0.0   8:16.11 snmpd
     9630 postgres  20   0 82900  22m  21m S    0  0.6   5:35.04 postgres
     9738 postgres  20   0 82928  25m  24m S    0  0.6  10:35.62 postgres
    13133 postgres  20   0 82608 5524 4408 S    0  0.1   0:00.02 postgres
    30253 root      20   0 17952 9944 3444 S    0  0.2   0:07.94 mailsec-reporte
        1 root      20   0  1816  544  524 S    0  0.0   0:06.01 init
        2 root      20   0     0    0    0 S    0  0.0   0:00.00 kthreadd
        3 root      RT   0     0    0    0 S    0  0.0   0:00.56 migration/0
        4 root      20   0     0    0    0 S    0  0.0   0:07.84 ksoftirqd/0
        5 root      RT   0     0    0    0 S    0  0.0   0:00.56 migration/1
        6 root      20   0     0    0    0 S    0  0.0   0:05.48 ksoftirqd/1
        7 root      RT   0     0    0    0 S    0  0.0   0:00.56 migration/2
        8 root      20   0     0    0    0 S    0  0.0   0:07.35 ksoftirqd/2
        9 root      RT   0     0    0    0 S    0  0.0   0:00.58 migration/3
       10 root      20   0     0    0    0 S    0  0.0   0:10.11 ksoftirqd/3
       11 root      20   0     0    0    0 S    0  0.0  10:34.23 events/0
       13 root      20   0     0    0    0 S    0  0.0   0:21.84 events/2
       14 root      20   0     0    0    0 S    0  0.0   1:14.36 events/3
       15 root      20   0     0    0    0 S    0  0.0   0:00.02 khelper
       20 root      20   0     0    0    0 S    0  0.0   0:00.00 async/mgr
       21 root      20   0     0    0    0 S    0  0.0   0:00.00 pm
       89 root      20   0     0    0    0 S    0  0.0   0:00.62 sync_supers
       91 root      20   0     0    0    0 S    0  0.0   0:01.13 bdi-default
       93 root      20   0     0    0    0 S    0  0.0   0:02.48 kblockd/0
       94 root      20   0     0    0    0 S    0  0.0   0:01.56 kblockd/1
       95 root      20   0     0    0    0 S    0  0.0   0:02.53 kblockd/2


    Dunno what that was.
  • That was a bit too early to say.

    CPU usage is still quite a bit higher than normally. Some ideas anybody?

    Regards
    Alex
  • Our 625, running 8.305, that has done the same twice in the last 24 hours.  Both instances during our primary business hours but not particularly high traffic that I can tell. 

    Started approximately 13:10 Eastern (UTC -5) 11/15 and less pronounced ~7:xx 11/16.  I'm not certain that changing to only single scan (our norm is dual) or the resulting(?) httpproxy restart is what resolves the issue.  I changed back to dual after hours between the spikes.

    Attached are daily, weekly and monthly graphs to show our typical patterns.

    The high baseline seen in Monthly was resolved by rebuilding the database which I also did again yesterday.