

Hi....
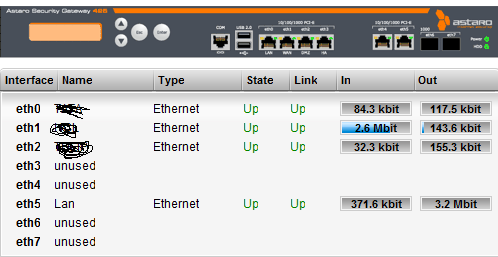
Any Body can tell me, why only one interface (eth1) is showing in sky blue colour...???
and what is the mean of it...??
This thread was automatically locked due to age.
Hi....
Any Body can tell me, why only one interface (eth1) is showing in sky blue colour...???
and what is the mean of it...??


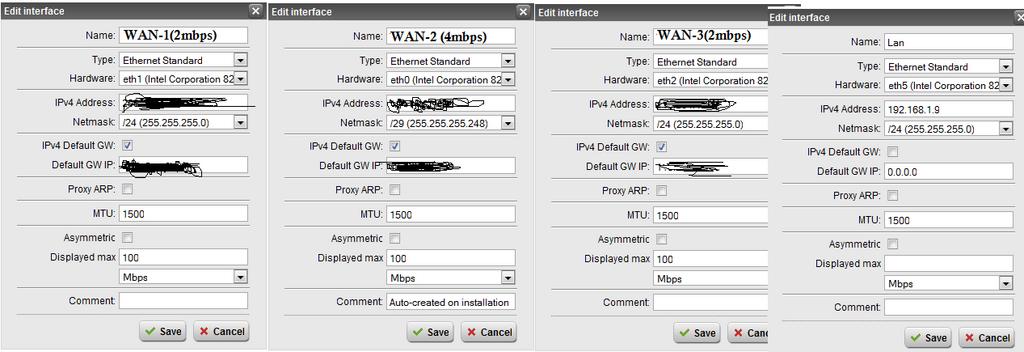
1.Let me explain.. I have 3 wan interface as u seen, One is 4mbps(e0), and other tow are 2mbps(e1,e2)..
But why it is showing on only eth1...????
EDIT: I just tried in Astaro demo unit (I don't have a v8 yet), but my guessing was not correct, asg does not set the max bandwidth value for the dashboard from QoS. Sorry!

That looks like a bug you found!
Cheers - Bob
