

I haven't changed a thing on my network, and this just decided to pop up for no reason.
Can we hope that this issue is being looked at/resolved?

This thread was automatically locked due to age.
Edit /etc/init.d/iptables
Comment out modprobe -q nf_conntrack_dns

This problem should have been fixed last year. Are you seeing a problem like the one in the graph at the top of this page?
Cheers - Bob
You should get Sophos Support involved if you have a paid license. If not, I would get several config backups off the device and re-install from ISO.
Cheers - Bob

Scoreboard is Full
After going through countless logs I kept finding logs pertaining to “scoreboard is full”. I started seeing this log when we started to see large amounts of traffic on the utm.
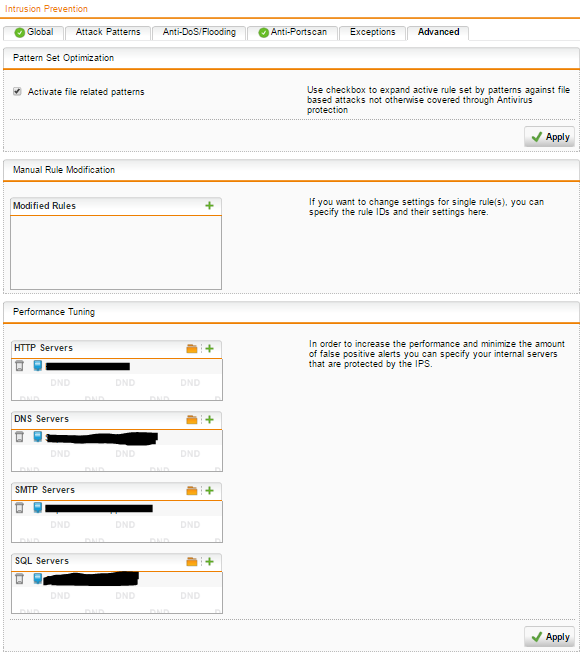
FYI: I currently utilize WAF and IPS on the utm.
What we are experiencing is when there is a large amount of incoming concurrent connections that are coming into the WAF… the utm can’t keep up with it.
After researching the issue could find nothing to assist me and point me in the right direction(if you have found something feel free to post it, I would appreciate it).
There were a few questions I had to ask to get clarity on the dreadful “scoreboard is Full” and why my utm is bombing with large amounts of concurrent connections.
Option 1
After looking at option two I started to think why would I need to change this unless something is not configured properly or not configured to the clients specific environment.
I then built a test environment where I replicated the traffic to the utm (WAF) however the utm never seized and all worked just fine maybe a little sluggish. I generated traffic flow of 15000 concurrent connections and then hit it with a brute force attack J.
Needless to say that the sites were slow and barely responded but obvious reasons, however it never responded with “Scoreboard is Full” but the whole time the CPU was sitting at 99% usage.
I won’t lie I was baffled, then I realized I did not have ips turned on in my test environment. I am currently in testing my theory.
I still currently testing my theory with regards to the ips, please note that option 2 was given to me by Sophos support.
Option 2
(Supplied by Sophos Support)
I will first be testing option 1 before I carry out option 2
So after seeing that the CPU was taking a knock I decided to query the number of the processor that was allocated to the CPU.
What was also happening the utm was unable to do local logging an I suspect that the utm could not process everything at the same time and when the client turned local logging he found that it made a difference, but this is not the fix or solution.
There is an option to increase the scoreboard via the UTM shell but you should be careful to make sure the box is powerful enough to do this. If it is already low on resources then this would not be suitable and the customer should instead consider upgrading their UTM.
To manually increase these settings you can add to the max_threads_per_process$ in cc,a good starting point would be to add 20 - 25 to this value.
Locate current figure
Change the current figure
Hope this has shed some light in what im experiencing and maybe you are going through and if it could save you some time in your investigations im happy to do that.
In conclusion if any of you have experienced this in any form or way, please feel free to and your results and ideas that can prevent this.
Scoreboard is Full
After going through countless logs I kept finding logs pertaining to “scoreboard is full”. I started seeing this log when we started to see large amounts of traffic on the utm.
FYI: I currently utilize WAF and IPS on the utm.
What we are experiencing is when there is a large amount of incoming concurrent connections that are coming into the WAF… the utm can’t keep up with it.
After researching the issue could find nothing to assist me and point me in the right direction(if you have found something feel free to post it, I would appreciate it).
There were a few questions I had to ask to get clarity on the dreadful “scoreboard is Full” and why my utm is bombing with large amounts of concurrent connections.
Option 1
After looking at option two I started to think why would I need to change this unless something is not configured properly or not configured to the clients specific environment.
I then built a test environment where I replicated the traffic to the utm (WAF) however the utm never seized and all worked just fine maybe a little sluggish. I generated traffic flow of 15000 concurrent connections and then hit it with a brute force attack J.
Needless to say that the sites were slow and barely responded but obvious reasons, however it never responded with “Scoreboard is Full” but the whole time the CPU was sitting at 99% usage.
I won’t lie I was baffled, then I realized I did not have ips turned on in my test environment. I am currently in testing my theory.
I still currently testing my theory with regards to the ips, please note that option 2 was given to me by Sophos support.
Option 2
(Supplied by Sophos Support)
I will first be testing option 1 before I carry out option 2
So after seeing that the CPU was taking a knock I decided to query the number of the processor that was allocated to the CPU.
What was also happening the utm was unable to do local logging an I suspect that the utm could not process everything at the same time and when the client turned local logging he found that it made a difference, but this is not the fix or solution.
There is an option to increase the scoreboard via the UTM shell but you should be careful to make sure the box is powerful enough to do this. If it is already low on resources then this would not be suitable and the customer should instead consider upgrading their UTM.
To manually increase these settings you can add to the max_threads_per_process$ in cc,a good starting point would be to add 20 - 25 to this value.
Locate current figure
Change the current figure
Hope this has shed some light in what im experiencing and maybe you are going through and if it could save you some time in your investigations im happy to do that.
In conclusion if any of you have experienced this in any form or way, please feel free to and your results and ideas that can prevent this.