

[[:)]]
A colleague highly recommend UTM 9 to me because he runs a commercial version for *** compliance at several facilities and one at his house for his family cannot say enough about it. After getting my box up and running, I must say that I am *extremely* impressed it and I am eager to flatten my learning curve.
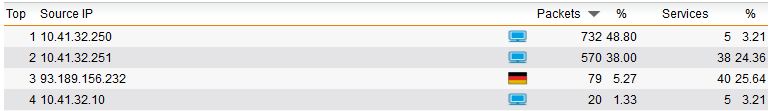
Using the web interface, is there a way to see why the offending host's packets were dropped?
For example, host 93.189.156.232 has 79 packets that were dropped. However, when I click on the host, all I get shown is a listing of ports that the host tried to connect to on the UTM.
Going to the actual logfile, I can see that the host was trying to send email:
2012:10:13-00:33:02 utm ulogd[4301]: id="2001" severity="info" sys="SecureNet" sub="packetfilter" name="Packet dropped" action="drop" fwrule="60001" initf="ppp0" srcip="93.189.156.232" dstip="127.0.0.1" proto="6" length="40" tos="0x00" prec="0x00" ttl="49" srcport="25" dstport="53796" tcpflags="RST"To restate my original qestion, how can I see what the host was trying to do via the web interface? I suppose what I am looking for is something that said that 93.189.156.232 tried to connect using SMTP and was denied ...
[s]For the logfile text, is there an option to new line the logfile instead of putting it out as a glob of text?[/s]
meh, the lack of newline is a notepad issue. Firefox and notepad++ displayed it a-okay. Disregard. [[:)]]
Thanks!
This thread was automatically locked due to age.

