Guest User!

You are not Sophos Staff.

This discussion has been locked.
You can no longer post new replies to this discussion. If you have a question you can start a new discussion

Stats by time and client

I've been using Sophos UTM at home, with a home license, for around a week now.  So far, I really like it a lot!  However, there's one thing I really want but can't seem to find:  Usage statistics by time AND client.  In other words, who's doing what and when.

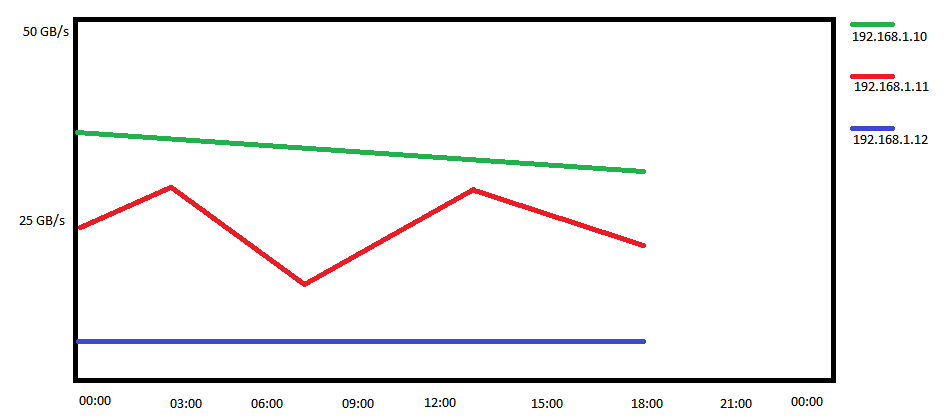
For example, I would like a graph, by time, for today or yesterday or a specific date, that shows the top 5 or 10 client IP addresses using bandwidth and/or making requests.  It might look something like the attachment.

I'd also like to be able to drill down or filter on an IP address, where I would see bandwidth and requests for that IP address in a table, aggregated by hour.

Is there a report in Sophos UTM that does this already, and I just can't find it?  If not, is there any chance this might be included in a future release?

Thanks,
John


This thread was automatically locked due to age.
  • Nothing exactly like you're asking for, but plenty of information available at Logging & Reporting in WebAdmin.

    You can always export the raw logs to an external database via syslog and use the information to build your own graphs.  There used to be a splunk project for this purpose.

    If you wish to see this added, please file a feature request at UTM (Formerly ASG) Feature Requests: Hot (2020 ideas).  This is the only location Sophos uses to consider feature adds from.  Be very detailed in your description.  In your request write-up, justify the time and expense Sophos would need to do this, by explaining how it would be useful for paid business license users.
    __________________
    ACE v8/SCA v9.3

    ...still have a v5 install disk in a box somewhere.

    http://xkcd.com
    http://www.tedgoff.com/mb
    http://www.projectcartoon.com/cartoon/1
  • Hi, John, and welcome to the User BB!

    In fact, there's a lot of information in 'Logging & Reporting' on the 'Bandwidth Usage' tab of 'Network Usage' and on the 'Web Usage Report' tab of 'Web Filtering'.  You can't get the graph style you show, but you can get pie charts by clicking on that icon at the upper-right of the data displayed on those tabs.  If you click on an individual line on the page, you get details for it.  I suspect that there's more information than you want! [;)]

    Cheers - Bob
     
    Sophos UTM Community Moderator
    Sophos Certified Architect - UTM
    Sophos Certified Engineer - XG
    Gold Solution Partner since 2005
    MediaSoft, Inc. USA
  • Network traffic:  Does your version of the UTM software have granularity finer than "day" in the reporting database?  See: https://community.sophos.com/products/unified-threat-management/astaroorg/f/53/t/34404

    Does iView offer these features/functions?
  • IMO iView in current form is not usable.  Too much is broken.
    __________________
    ACE v8/SCA v9.3

    ...still have a v5 install disk in a box somewhere.

    http://xkcd.com
    http://www.tedgoff.com/mb
    http://www.projectcartoon.com/cartoon/1
  • Thank you all for the quick replies.  I took a look inside the reporting database (UTM 9.307-6), and it appears that all the pertinent tables have 1-day resolution.  I don't think Sophos is going to change that just so I can have a couple reports by minute and/or hour, so I'll see what I can do with the raw data (syslog, splunk).
  • So I downloaded and installed Splunk on my Win7 desktop, configured it to accept syslog data, configured Sophos to send web filter syslog data to my desktop, and that's working fine.  I can mostly see what I want for HTTP/S requests and domains requested.  What else do I need to forward to Splunk in order to see bandwidth statistics?  That part isn't clear to me at all.
  • I believe this is where Scott was referencing a Splunk project for Sophos. I use Splunk as well but at a basic level. You could run this search;

    host="UTM NAME" srcip="*" | timechart count by srcip limit=10

    This would provide a visual like you requested using both Firewall and Proxy logs. [:)]
  • Hi, 

    You won't get bandwidth info from syslogs; you need to use either a SNMP tool (for interface statistics only, no flow details) or NetFlow/IPFix.

    Barry
  • Hi, 

    You won't get bandwidth info from syslogs; you need to use either a SNMP tool (for interface statistics only, no flow details) or NetFlow/IPFix.

    Barry


    Don't mean to de-rail - Barry, can the UTM provide netflow into a monitoring tool?
  • Don't mean to de-rail - Barry, can the UTM provide netflow into a monitoring tool?


    Supposedly. I haven't tried it, but if you search these forums you will see some people who have.
    I'm not sure which products work.

    Barry
Share Feedback
×

Submitted a Tech Support Case lately from the Support Portal?