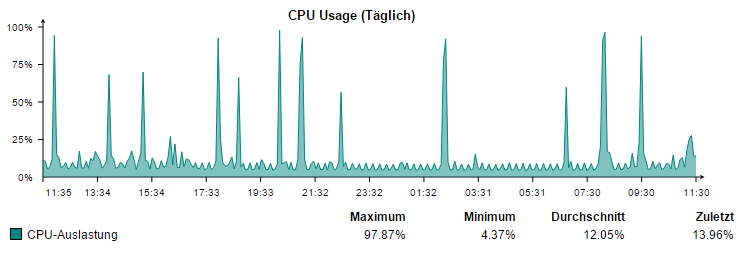
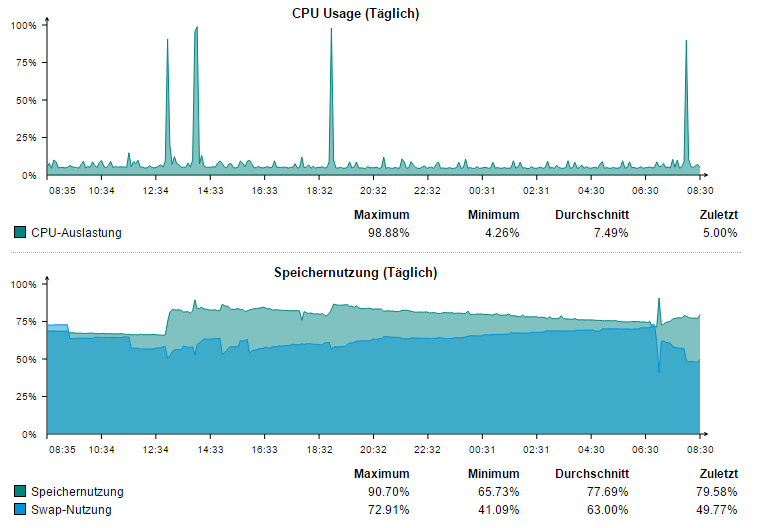
Something I had not noticed before has been bought to my attention by a few early risers in the office. They claim that at about 7:00AM in the morning, the network drops for quite a few minutes. I was skeptical at first, then dug into the logs and found this in the System log, can anyone explain what is going on?
2015:02:12-06:55:31 per ulogd[22574]: ct1: nl_recvmsgs: Try again
2015:02:12-06:56:02 per /usr/sbin/cron[4320]: (root) CMD (/sbin/audld.plx --trigger)
2015:02:12-06:56:42 per postgres[4418]: [3-1] WARNING: pgstat wait timeout
2015:02:12-06:56:48 per postgres[3898]: [95-1] WARNING: pgstat wait timeout
2015:02:12-06:57:48 per dns-resolver[4566]: Changeset 11858 empty!
2015:02:12-06:57:49 per dns-resolver[4566]: Adding REF_NetDnsMm00818mic
2015:02:12-06:57:49 per dns-resolver[4566]: Adding REF_NetDnsClientvpnt
2015:02:12-06:57:49 per dns-resolver[4566]: Adding REF_NetDnsPersrvexch
2015:02:12-06:57:49 per dns-resolver[4566]: Adding REF_NetDnsClientvpnr
2015:02:12-06:57:49 per dns-resolver[4566]: Adding REF_NetDnsTenroxmicr
2015:02:12-06:57:49 per dns-resolver[4566]: Adding REF_NetDnsPersrvsmmi
2015:02:12-06:57:49 per dns-resolver[4566]: Adding REF_NetDnsLonsrvexch
2015:02:12-06:57:49 per dns-resolver[4566]: Adding REF_NetDnsClientvpnt2
2015:02:12-06:57:49 per dns-resolver[4566]: Adding REF_NetDnsClientvpnc2
2015:02:12-06:57:49 per dns-resolver[4566]: Adding REF_NetDnsFsmicromin
2015:02:12-06:57:49 per dns-resolver[4566]: Adding REF_NetDnsPersrvjirm
2015:02:12-06:57:49 per dns-resolver[4566]: Adding REF_NetDnsClientvpnk
2015:02:12-06:57:49 per dns-resolver[4566]: Adding REF_NetDnsClientvpnm
2015:02:12-06:57:49 per dns-resolver[4566]: Adding REF_DefaultSophosUTMSupportHost
2015:02:12-06:57:49 per dns-resolver[4566]: Adding REF_NetDnsSvnmicromi
2015:02:12-06:57:49 per dns-resolver[4566]: Adding REF_NetDnsMm00868mic
2015:02:12-06:57:49 per dns-resolver[4566]: Adding REF_NetDnsPersrvsp01
2015:02:12-06:57:49 per dns-resolver[4566]: Adding REF_NetDnsPerbar01mi
2015:02:12-06:57:49 per dns-resolver[4566]: Adding REF_NetDnsClientvpn
2015:02:12-06:57:49 per dns-resolver[4566]: Adding REF_NetDnsClientvpnc
2015:02:12-06:57:49 per dns-resolver[4566]: Adding REF_NetDnsClientvpnn
2015:02:12-06:57:49 per dns-resolver[4566]: Adding REF_NetDnsPersrvldsm
2015:02:12-06:57:49 per dns-resolver[4566]: Adding REF_NetDnsPersrv3cxm
2015:02:12-06:57:49 per dns-resolver[4566]: Adding REF_NetDnsClientvpnn2
2015:02:12-06:57:49 per dns-resolver[4566]: Adding REF_NetDnsMailoptusn
2015:02:12-06:57:49 per dns-resolver[4566]: Adding REF_NetDnsSophoLivec
2015:02:12-06:57:49 per dns-resolver[4566]: Adding REF_NtpPool
2015:02:12-06:57:50 per dns-resolver[4566]: No change to REF_NetDnsPersrvexch :: per-srv-exch01.micromine.com.au
2015:02:12-06:57:50 per dns-resolver[4566]: No change to REF_NetDnsPersrv3cxm :: per-srv-3cx.micromine.com.au
2015:02:12-06:57:51 per dns-resolver[4566]: No change to REF_NetDnsClientvpnn :: mail.nsrltd.com
2015:02:12-06:57:51 per dns-resolver[4566]: No change to REF_NetDnsSvnmicromi :: svn.micromine.com.au
2015:02:12-06:57:51 per dns-resolver[4566]: No change to REF_NetDnsClientvpnk :: vpn.kinross.com
2015:02:12-06:57:51 per dns-resolver[4566]: No change to REF_DefaultSophosUTMSupportHost :: dispatch.apu.sophos.com
2015:02:12-06:57:52 per dns-resolver[4566]: No change to REF_NetDnsClientvpnt2 :: emeacag2.trafigura.com
2015:02:12-06:57:52 per dns-resolver[4566]: No change to REF_NetDnsTenroxmicr :: tenrox.micromine.com.au
2015:02:12-06:57:52 per dns-resolver[4566]: No change to REF_NetDnsClientvpnr :: archway.riotinto.com
2015:02:12-06:57:52 per dns-resolver[4566]: No change to REF_NetDnsClientvpnm :: pitramportal.cloudapp.net
2015:02:12-06:57:52 per dns-resolver[4566]: No change to REF_NetDnsMm00818mic :: mm00818.micromine.com.au
2015:02:12-06:57:52 per dns-resolver[4566]: Updating REF_NtpPool :: au.pool.ntp.org
2015:02:12-06:58:13 per dns-resolver[4566]: No change to REF_NetDnsClientvpnc2 :: sgm.crocgold.com.au
2015:02:12-06:58:13 per dns-resolver[4566]: No change to REF_NetDnsLonsrvexch :: lon-srv-exch01.micromine.com.au
2015:02:12-06:58:13 per dns-resolver[4566]: No change to REF_NetDnsPerbar01mi :: perbar01.micromine.com.au
2015:02:12-06:58:13 per dns-resolver[4566]: No change to REF_NetDnsPersrvldsm :: per-srv-lds.micromine.com.au
2015:02:12-06:58:14 per dns-resolver[4566]: No change to REF_NetDnsClientvpn :: vpn.adityabirla.com.au
2015:02:12-06:58:14 per dns-resolver[4566]: No change to REF_NetDnsPersrvsmmi :: per-srv-sm.micromine.com.au
2015:02:12-06:58:14 per dns-resolver[4566]: No change to REF_NetDnsMm00868mic :: mm00868.micromine.com.au
2015:02:12-06:58:14 per dns-resolver[4566]: No change to REF_NetDnsMailoptusn :: mail.optusnet.com.au
2015:02:12-06:58:14 per dns-resolver[4566]: No change to REF_NetDnsPersrvsp01 :: per-srv-sp01.micromine.com.au
2015:02:12-06:58:14 per dns-resolver[4566]: No change to REF_NetDnsFsmicromin :: fs.micromine.com.au
2015:02:12-06:58:15 per dns-resolver[4566]: No change to REF_NetDnsClientvpnc :: mail.cmpl.com.au
2015:02:12-06:58:15 per dns-resolver[4566]: No change to REF_NetDnsClientvpnt :: emeacag.trafigura.com
2015:02:12-06:58:15 per dns-resolver[4566]: No change to REF_NetDnsPersrvjirm :: per-srv-jir.micromine.com.au
2015:02:12-06:58:16 per dns-resolver[4566]: No change to REF_NetDnsClientvpnn2 :: yka-vpn.newgold.com
2015:02:12-06:58:30 per postgres[3898]: [96-1] WARNING: pgstat wait timeout
2015:02:12-06:58:54 per ntpd[810]: ntpd exiting on signal 15
2015:02:12-06:58:55 per ntpd[4847]: ntpd 4.2.6p5@1.2349 Tue Feb 4 13:03:59 UTC 2014 (1)
2015:02:12-06:58:55 per ntpd[4848]: proto: precision = 0.356 usec
2015:02:12-06:58:55 per ntpd[4848]: ntp_io: estimated max descriptors: 1024, initial socket boundary: 16
2015:02:12-06:58:55 per ntpd[4848]: Listen and drop on 0 v4wildcard 0.0.0.0 UDP 123
2015:02:12-06:58:55 per ntpd[4848]: Listen and drop on 1 v6wildcard :: UDP 123
2015:02:12-06:58:55 per ntpd[4848]: Listen normally on 2 lo 127.0.0.1 UDP 123
2015:02:12-06:58:55 per ntpd[4848]: Listen normally on 3 eth0 192.168.3.1 UDP 123
2015:02:12-06:58:55 per ntpd[4848]: Listen normally on 4 eth0 172.16.10.1 UDP 123
2015:02:12-06:58:55 per ntpd[4848]: Listen normally on 5 eth1 203.153.227.210 UDP 123
2015:02:12-06:58:55 per ntpd[4848]: Listen normally on 6 eth1 203.11.69.101 UDP 123
2015:02:12-06:58:55 per ntpd[4848]: Listen normally on 7 eth1 203.11.69.45 UDP 123
2015:02:12-06:58:55 per ntpd[4848]: Listen normally on 8 eth1 203.11.69.49 UDP 123
2015:02:12-06:58:55 per ntpd[4848]: Listen normally on 9 eth1 203.11.69.69 UDP 123
2015:02:12-06:58:55 per ntpd[4848]: Listen normally on 10 eth1 203.11.69.56 UDP 123
2015:02:12-06:58:55 per ntpd[4848]: Listen normally on 11 eth1 203.11.69.58 UDP 123
2015:02:12-06:58:55 per ntpd[4848]: Listen normally on 12 eth1 203.11.69.55 UDP 123
2015:02:12-06:58:55 per ntpd[4848]: Listen normally on 13 eth1 203.11.69.54 UDP 123
2015:02:12-06:58:55 per ntpd[4848]: Listen normally on 14 eth1 203.11.69.67 UDP 123
2015:02:12-06:58:55 per ntpd[4848]: Listen normally on 15 eth1 203.11.69.22 UDP 123
2015:02:12-06:58:55 per ntpd[4848]: Listen normally on 16 eth1 203.11.69.13 UDP 123
2015:02:12-06:58:55 per ntpd[4848]: Listen normally on 17 eth1 203.11.69.20 UDP 123
2015:02:12-06:58:55 per ntpd[4848]: Listen normally on 18 eth1 203.11.69.60 UDP 123
2015:02:12-06:58:55 per ntpd[4848]: Listen normally on 19 eth1 203.11.69.46 UDP 123
2015:02:12-06:58:55 per ntpd[4848]: Listen normally on 20 eth2 203.11.69.1 UDP 123
2015:02:12-06:58:55 per ntpd[4848]: Listen normally on 21 wlan1 172.16.30.1 UDP 123
2015:02:12-06:58:55 per ntpd[4848]: Listen normally on 22 wlan0 172.16.28.1 UDP 123
2015:02:12-06:58:55 per ntpd[4848]: Listen normally on 23 wlan2 172.16.29.1 UDP 123
2015:02:12-06:58:55 per ntpd[4848]: Listen normally on 24 tun0 10.242.2.1 UDP 123
2015:02:12-06:58:55 per ntpd[4848]: Listen normally on 25 ifb1 fe80::86:5bff:febb:e295 UDP 123
2015:02:12-06:58:55 per ntpd[4848]: Listen normally on 26 lo ::1 UDP 123
2015:02:12-06:58:55 per ntpd[4848]: Listen normally on 27 wlan0 fe80::21a:8cff:fe0a:af00 UDP 123
2015:02:12-06:58:55 per ntpd[4848]: Listen normally on 28 wlan2 fe80::21a:8cff:fe0a:c702 UDP 123
2015:02:12-06:58:55 per ntpd[4848]: Listen normally on 29 wlan1 fe80::21a:8cff:fe0a:1101 UDP 123
2015:02:12-06:58:55 per ntpd[4848]: Listen normally on 30 redw1.102 fe80::21a:8cff:fe0a:c702 UDP 123
2015:02:12-06:58:55 per ntpd[4848]: Listen normally on 31 redw2.102 fe80::21a:8cff:fe0a:c702 UDP 123
2015:02:12-06:58:55 per ntpd[4848]: Listen normally on 32 redw0.102 fe80::21a:8cff:fe0a:c702 UDP 123
2015:02:12-06:58:55 per ntpd[4848]: Listen normally on 33 redw1.100 fe80::21a:8cff:fe0a:af00 UDP 123
2015:02:12-06:58:55 per ntpd[4848]: Listen normally on 34 redw2.100 fe80::21a:8cff:fe0a:af00 UDP 123
2015:02:12-06:58:55 per ntpd[4848]: Listen normally on 35 redw0.100 fe80::21a:8cff:fe0a:af00 UDP 123
2015:02:12-06:58:55 per ntpd[4848]: Listen normally on 36 redw1.101 fe80::21a:8cff:fe0a:1101 UDP 123
2015:02:12-06:58:55 per ntpd[4848]: Listen normally on 37 redw2.101 fe80::21a:8cff:fe0a:1101 UDP 123
2015:02:12-06:58:55 per ntpd[4848]: Listen normally on 38 redw0.101 fe80::21a:8cff:fe0a:1101 UDP 123
2015:02:12-06:58:55 per ntpd[4848]: Listen normally on 39 ifb0 fe80::fc79:97ff:fe94:9fdc UDP 123
2015:02:12-06:58:55 per ntpd[4848]: Listen normally on 40 redw1 fe80::201c[:D]3ff:fe9e:b8ce UDP 123
2015:02:12-06:58:55 per ntpd[4848]: Listen normally on 41 redw2 fe80::6c2d:53ff:fe2f:9e21 UDP 123
2015:02:12-06:58:55 per ntpd[4848]: Listen normally on 42 eth2 fe80::21a:8cff:fe17:fbb2 UDP 123
2015:02:12-06:58:55 per ntpd[4848]: Listen normally on 43 eth0 fe80::21a:8cff:fe17:fbb0 UDP 123
2015:02:12-06:58:55 per ntpd[4848]: Listen normally on 44 eth1 fe80::21a:8cff:fe17:fbb1 UDP 123
2015:02:12-06:58:55 per ntpd[4848]: Listen normally on 45 redw0 fe80:[:D]c9c[:D]bff:fe85:cb00 UDP 123
2015:02:12-06:58:55 per ntpd[4848]: Listen normally on 46 ifb2 fe80::b015:69ff:fef2:3600 UDP 123
2015:02:12-06:58:55 per ntpd[4848]: peers refreshed
2015:02:12-06:58:55 per ntpd[4848]: Listening on routing socket on fd #63 for interface updates
2015:02:12-06:59:33 per syslog-ng[4934]: Configuration reload request received, reloading configuration;
2015:02:12-06:59:26 per ulogd[22574]: SIGTERM received
2015:02:12-07:00:03 per /usr/sbin/cron[5156]: (root) CMD ( /usr/local/bin/reporter/system-reporter.pl)
2015:02:12-07:00:03 per /usr/sbin/cron[5159]: (root) CMD (/usr/local/bin/create_rrd_graphs.plx --acc)
2015:02:12-07:00:03 per /usr/sbin/cron[5160]: (root) CMD ( /var/chroot-httpd/var/webadmin/extra/httpd_session_cleanup)
2015:02:12-07:00:03 per /usr/sbin/cron[5162]: (root) CMD (/var/mdw/scripts/pmx-blocklist-update)
2015:02:12-07:00:03 per /usr/sbin/cron[5161]: (root) CMD ( /usr/local/bin/rpmdb_backup )
2015:02:12-07:00:17 per postgres[3898]: [97-1] WARNING: pgstat wait timeout
2015:02:12-07:01:02 per /usr/sbin/cron[5480]: (httpproxy) CMD (/var/chroot-http/usr/bin/virus_sample_uploader -p /var/chroot-http)
2015:02:12-07:02:03 per /usr/sbin/cron[5834]: (root) CMD ( nice -n19 /usr/local/bin/gen_inline_reporting_data.plx)
2015:02:12-07:03:27 per postgres[3898]: [98-1] WARNING: pgstat wait timeout
2015:02:12-07:03:38 per postgres[3898]: [99-1] WARNING: pgstat wait timeout
2015:02:12-07:03:24 per postgres[6001]: [3-1] WARNING: pgstat wait timeout
2015:02:12-07:03:30 per postgres[6027]: [3-1] WARNING: pgstat wait timeout
2015:02:12-07:03:38 per postgres[6134]: [3-1] WARNING: pgstat wait timeout
2015:02:12-07:04:34 per ulogd[22574]: timerfd: read: Bad file descriptor
2015:02:12-07:05:02 per /usr/sbin/cron[6525]: (root) CMD ( /usr/local/bin/reporter/system-reporter.pl)
2015:02:12-07:05:09 per postgres[3898]: [100-1] WARNING: pgstat wait timeout
2015:02:12-07:05:32 per ulogd[6908]: ulogd running
2015:02:12-07:06:25 per postgres[3898]: [101-1] WARNING: pgstat wait timeout
2015:02:12-07:07:02 per /usr/sbin/cron[7131]: (httpproxy) CMD (/var/chroot-http/usr/bin/virus_feedback_uploader)
2015:02:12-07:07:27 per postgres[3898]: [102-1] WARNING: pgstat wait timeout
2015:02:12-07:08:17 per postgres[7277]: [3-1] WARNING: pgstat wait timeout
2015:02:12-07:08:50 per postgres[7379]: [3-1] WARNING: pgstat wait timeout
2015:02:12-07:10:01 per /usr/sbin/cron[7952]: (root) CMD ( /usr/local/bin/reporter/system-reporter.pl)
2015:02:12-07:10:01 per /usr/sbin/cron[7949]: (root) CMD (/var/mdw/scripts/pmx-blocklist-update)
2015:02:12-07:10:18 per postgres[3898]: [103-1] WARNING: pgstat wait timeout
2015:02:12-07:11:02 per /usr/sbin/cron[8280]: (httpproxy) CMD (/var/chroot-http/usr/bin/virus_sample_uploader -p /var/chroot-http)
2015:02:12-07:11:02 per /usr/sbin/cron[8283]: (root) CMD (/sbin/audld.plx --trigger)
2015:02:12-07:11:28 per postgres[8355]: [3-1] LOG: sending cancel to blocking autovacuum PID 8337 at character 8Feb 12 07:11:28 postgres[8355]: [3-2] DETAIL: Process 8355 waits for RowExclusiveLock on relation 17165 of database 17144.
2015:02:12-07:11:28 per postgres[8355]: [3-3] STATEMENT: UPDATE m SET message_id='1YLgRI-0002Ag-Qd', location='output' WHERE message_id = '1YLgQx-00028l-22' AND cluster_id = '1' AND recipient = 'tm@micromine.com'
2015:02:12-07:11:30 per postgres[8337]: [3-1] ERROR: canceling autovacuum taskFeb 12 07:11:30 postgres[8337]: [3-2] CONTEXT: automatic vacuum of table "smtp.public.m"
2015:02:12-07:14:13 per adbs-maintenance[359]: running count_active_ip.plx
2015:02:12-07:14:13 per count_active_ip[8896]: count_active_ip: checking active IP addresses
2015:02:12-07:14:13 per count_active_ip[8896]: Unlimited License - no counting needed
2015:02:12-07:14:13 per adbs-maintenance[359]: finished ADBS maintenance run
2015:02:12-07:14:57 per ulogd[6908]: ct1: nl_recvmsgs: Try again
2015:02:12-07:15:01 per /usr/sbin/cron[9066]: (root) CMD (/usr/local/bin/create_rrd_graphs.plx --acc)
2015:02:12-07:15:01 per /usr/sbin/cron[9067]: (root) CMD ( /usr/local/bin/reporter/system-reporter.pl)
This thread was automatically locked due to age.