

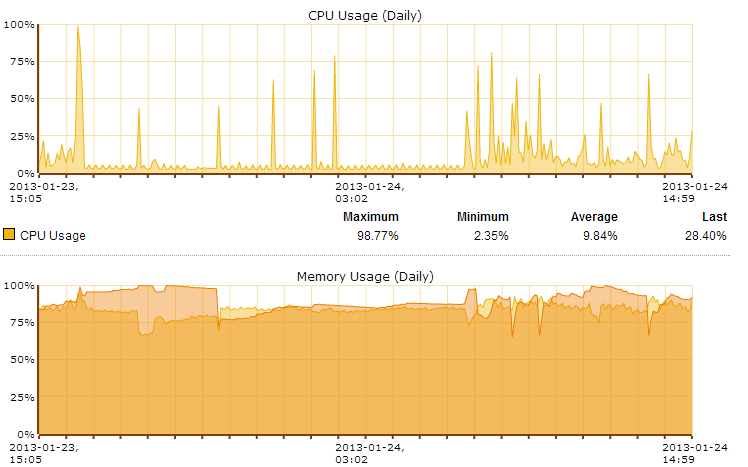
I have an ASG120 with 1G of memory. Over the past few weeks our memory swapping has been very high compared to previous weeks. Internet connectivity is also slowed pretty drastically. See the following from the dashboard - "The memory usage of this system during the last 7 days was high. The memory either averaged over 75% utilization or experienced multiple periods of full memory use. High memory usage can cause hard disk swapping which reduces throughput and increases latency of several applications."
I am not well versed in this product but if someone can point me in a direction to look for problems (in plainspeak), I would greatly appreciate it.
This thread was automatically locked due to age.
