This discussion has been locked.
You can no longer post new replies to this discussion. If you have a question you can start a new discussion

Interface showing zero traffic in Dashboard and missing from reports

Hi all,

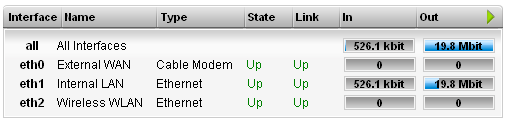
I have an interesting issue that I can't fix.  My dashboard shows no traffic on eth0 (external interface)... ever [:S].  In reports the interface is also never listed.  The funny thing is that the Flow Monitor shows traffic.... see attached images.  I tried to search the logs but I don't see anything.  I did find an issue with PostFix mailbox size error but fixed that issue using a post I found.  I also found that this started when I upgraded to 8.203... didn't notice for a while then didn't have time to deal with it.

Any suggestions... other than rebuilding from scratch, I don't want to lose my report data.

Thanks,
Paul

P.S. The downloading that you see in the image is from Microsoft and is not coming from any internal cache.


This thread was automatically locked due to age.
  • Do you see anything in the System messages log that might be related to this - maybe a PostgreSQL table issue?

    Cheers - Bob
     
    Sophos UTM Community Moderator
    Sophos Certified Architect - UTM
    Sophos Certified Engineer - XG
    Gold Solution Partner since 2005
    MediaSoft, Inc. USA
  • I searched the System Messages log and nothing of note.  This is weird but it is back.... I didn't do anything!

    I'll keep an eye on it for now.

    Thanks Bob.

    Paul

    P.S. I attached a Network Usage screen shot... nothing on eth0 until today.  The blank area starting 01-02 for 7 days is from us being on vacation, so no traffic.