Guest User!

You are not Sophos Staff.

This discussion has been locked.
You can no longer post new replies to this discussion. If you have a question you can start a new discussion

Interesting Traffic on WAN Interface...

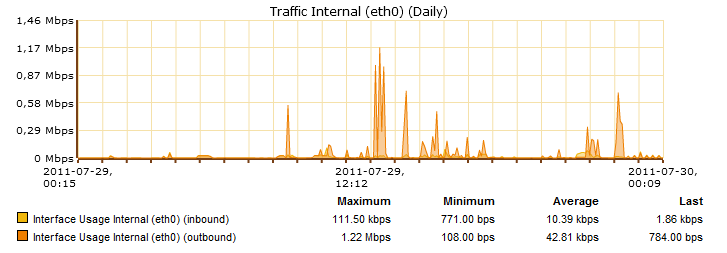
Got a call from the site tonight telling me that they were having issues with their credit card server timing out.  The site has a T1 connection and there was virtually no traffic except point of sale traffic at the site when they contacted me. I looked at the "Network Usage" graphs under reporting and saw strange anomalies; or at least what I perceive to be anomalies.  There is essentially no traffic on the LAN interface and no real discernible outbound traffic on the WAN interface, but there is this strange blip on the Inbound side of the WAN interface.  I remoted into the server and checked on things and it was painfully slow to connect through our remote interface during this traffic storm.  In checking logs, I found that there seems to be a pattern to the traffic.  It lasts about the same time and seems to occur at about the same intervals.  I was watching the WAN interface traffic during the last occurence and there was virtually nothing happening -- in fact, the location is closed at the moment --  and the interface is spiked on the inbound and nothing is happening.

I have attached screenshots of the graphs and I'm looking for maybe some direction on where to look in the logs to find this traffic and determine where it's coming from.

Any insight you can provide would be great.

Thanks in advance,
Joe J


This thread was automatically locked due to age.
  • Probably the quickest and easiest step is to take a look in the reporting section.  Need to determine the source, destination, and type of traffic.
  • Probably the quickest and easiest step is to take a look in the reporting section.  Need to determine the source, destination, and type of traffic.


    I checked out the Reporting -> Network Usage -> t has 5gb and the next closest is about 140MB.  That's congruent with my observation that the inbound traffic on the WAN interface is high. I can see that the highest trafficked service on that IP address of the External Address of the WAN interface is HTTP/80. I can't really see what's connecting to it though.  

    Any other suggestions or thoughts?

    Joe J
  • Now that we know it's port 80, you should be able to get more details from the web security section of reporting.  You'll also want to get the remote ip address for this traffic.  You can do a little information gathering on it (nslookup, whois, etc) to try and figure out what it is.  Since this is happening at regular intervals, if you are actively monitoring the situation, it wouldn't hurt to open up the web proxy live log to see what's happening while this traffic is taking place.

    BTW, what version of Astaro are you running?


    I'm running 8.103.

    Here's what's kind of odd. I'm seeing one of theses traffic spikes right now and have been watching the live web proxy and am only seeing some Teamviewer keep-alive traffic on our arcade POS servers so the vendor can get into it.  

    Another concerning element to me is that it's showing on the inbound side of the WAN interface but I'm not seeing that traffic transfer to either of the internal network interfaces.  

    With that said, I can't pick up a specific IP that's causing the traffic.

    Thanks Scott for the assistance thus far.

    Thanks,
    Joe J
  • Anything in Reporting>>Web Security>>Web Usage Tab>>Top Users?  Also, Reporting>>Network Usage>>Accounting Tab reports.  Notice that with these reports, you can click on the host, or ip address, or service (depending on which report), to get more info. Check the Packet Filter live log too, since this is happening right now.

    We're trying to get an ip address for the remote host.
  • Reporting>>Network Usage>>Accounting Tab yields the External WAN IP address as the "top client".  "Top Server" comes back as a Google IP (74.125.212.114) But it's still 6x less than this total I'm seeing.  The External WAN IP comes in at the #6 position with over 20,000 connections and the next closest is in the 120 connection range.. Top Services shows HTTP still being the highest traffic but strangely it's on the outbound side and not inbound like the graphs would suggest.

    Packet Filter Live is uneventful.  I turned on logging of Web Surfing traffic and there is quite a bit of SSL traffic from the expected places, based on what we do, but the traffic wasn't ridiculous for the time of day.  

    Total Traffic when I add it by hand from Web Security Top Users comes to 838.69MB but the http traffic for the day so far is 4.5GB.  Huge mismatch.

    Does any of that make sense to you?  I checked 3 of our other locations and we're not seeing traffic skewed like this; and certainly don't have these regular and explainable spikes.
  • One last shot to attempt information gathering.  In WebAdmin>>Network Security>>Packet Filter>>Advanced Tab, click on start Traffic Monitor.  Then you can click on the interface "bars" on the dashboard to get some information on current traffic passing through.  You can also get this information if you get away from the WebAdmin Gui.  There is a tool for viewing traffic from the shell in real time.  This would get you some info, next time the event occurs.  Iftop.  


    Other than this, since your not seeing anything that makes sense in the various reporting sections/logs, it may be time to open up a support ticket.  Either way, please post back.
  • I put in a ticket with a summary and referencing this thread so they can see what we have already gone through for testing.  I will report back after we find out the issue.  Thanks!
  • Just to wrap up this thread...

    The support engineer found that it was the Google Pack trying to phone home and update itself.  We added an exception for it and the crazy slow down and graphic log patterns went away. I have since moved that exception to all of our firewalls (5xASG120s)

    Amazing that something as simple as the update engine pounding the firewall could all but shut down the network throughput. 

    Thanks for the assistance!

    Joe J
  • Glad that you got it fixed Joe.  [:)]