

Hi,
Please take a look at the enclosed screen shots of my system.
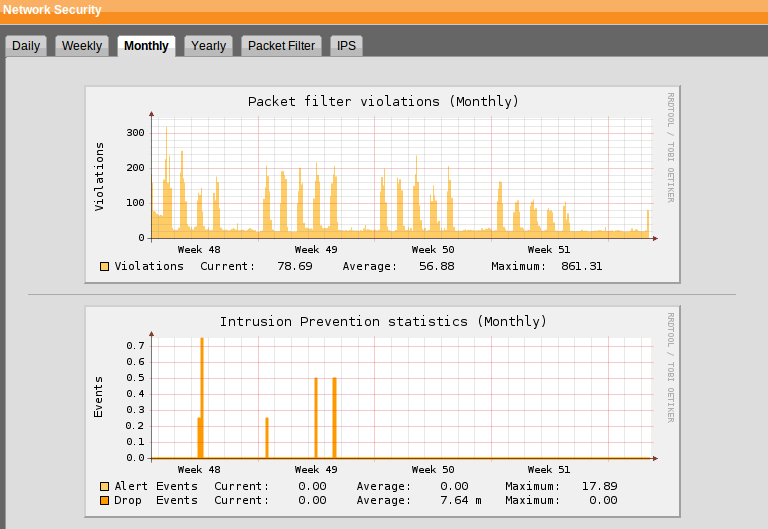
The graphs just don't make a lot of sense. Looking at the IPS graphs, what does the events label really mean - did I really have 0.7 network attacks - what unit is that.
It shows I have 7.64m as an average and yet the maximum is zero...
Looking at the yearly graph, it says I have had an average of 35.45m drop events (is that million?) and a max of 29.87 Alert events - neither of which make any sense looking at the graph where its just over 4?
Please can anyone shed any light on this?
Many thanks
Bryan
This thread was automatically locked due to age.

