Guest User!

You are not Sophos Staff.

This discussion has been locked.
You can no longer post new replies to this discussion. If you have a question you can start a new discussion

High CPU usage in cluster node

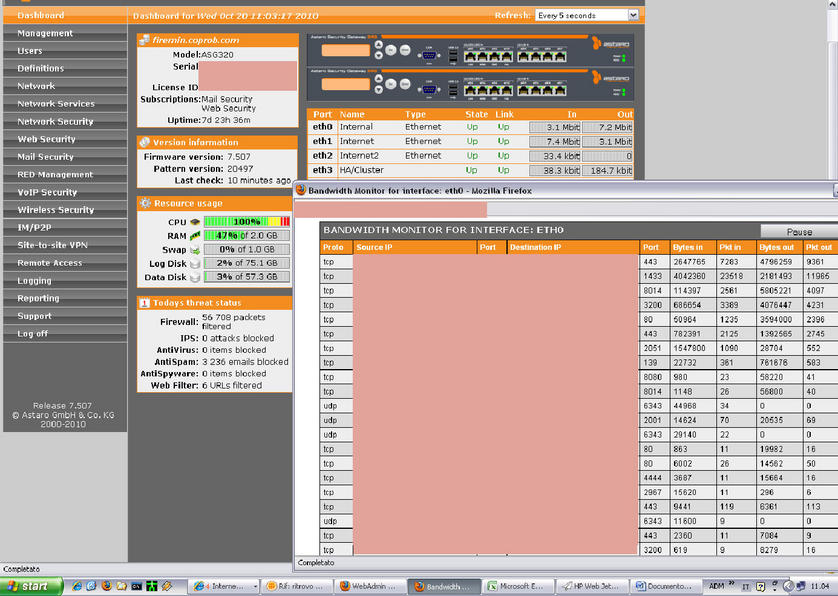
Hello, I have  2 ASG 320 in HA cluster configuration  and sometimes happen a strange problem:
The primary node  use high CPU ( 100% ) for 8-10 min; all performance degrade so VPN , incoming connections, and occasionally webadmin authentications fails.
I have identified some HA Sync daemon restart in those case
"HA confd sync daemon not running - restarted" and also "HA ctsync daemon not running - restarted".

Both ASG were restarted but problem persist; any idea ?

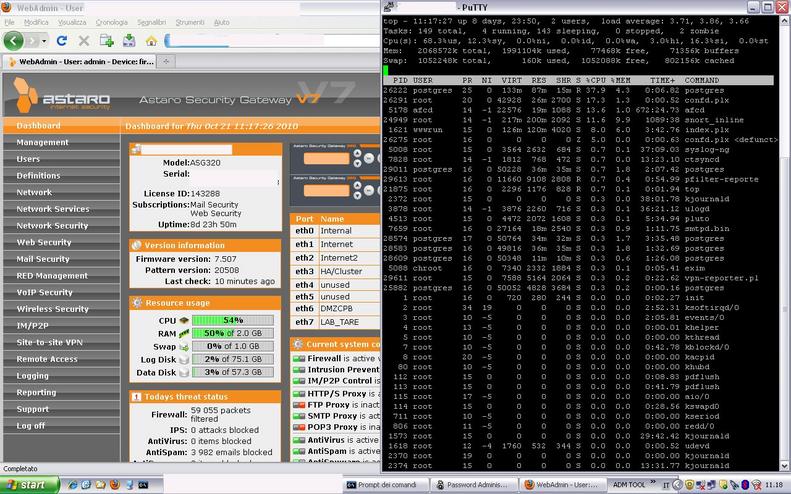
ASG version 7.507, pattern 20497
high cpu load was xpecially identifyed on the slave node, I suspect problem syncronization when changing role from master to slave

2010:10:20-10:56:27 firemin-2 kernel: nf_log_packet: can't log since no backend logging module loaded in! Please either load one, or disable logging explicitly
2010:10:20-10:56:28 firemin-2 kernel: asg_cluster: set master_id to 1
2010:10:20-10:56:49 firemin-2 kernel: nf_log_packet: can't log since no backend logging module loaded in! Please either load one, or disable logging explicitly

In my opinion when a high in/out going connection was detected and cpu load >80% cluster fail to check heartbeats and try to switch node but fail during datafile syncronizations.

look attached log :


This thread was automatically locked due to age.
  • You definitely should get Astaro Support involved.

    I think your analysis is correct.  You might start an SSH session and leave top running so that you can see what is causing 100% CPU.  I haven't heard of a Master being so busy that it didn't send a heartbeat.  Do you have a backup interface configured for the heartbeat?  Have you tried replacing the connection between the two ASGs with a new crossover cable?

    Interesting problem.  Please post your results.

    Cheers - Bob
  • i haven't tried to use SSH session for monitoring cpu usage; but using webadmin\support\advanced\process list i can't see cpu consuming pid ...

    At 11.04 i had the problem, look at those images: ( "puppet" is the slave )

    Consider that Eth3 is the HA cluster interface, the problem still persist using a cross cable or a dedicated hp procurve 2600 switch.

    also consider that:
    2010:10:20-10:58:35 firemin-1 ha_daemon[3262]: id="38A1" severity="warn" sys="System" sub="ha" name="Current load average 12.21 is high!"
    2010:10:20-10:58:37 firemin-2 ha_daemon[3217]: id="38A1" severity="warn" sys="System" sub="ha" name="Current load average 12.21 of node 1 is high, please check you system!"
    2010:10:20-10:59:37 firemin-1 ha_daemon[3262]: id="38A1" severity="warn" sys="System" sub="ha" name="Current load average 11.13 is high!"
    2010:10:20-11:00:08 firemin-2 slon[22563]: [16-1] CONFIG enableSubscription: sub_set=1
    2010:10:20-11:00:09 firemin-2 slon[22563]: [17-1] CONFIG storeListen: li_origin=1 li_receiver=2 li_provider=1
    2010:10:20-11:00:40 firemin-1 ha_daemon[3262]: id="38A1" severity="warn" sys="System" sub="ha" name="Current load average 15.07 is high!"
    2010:10:20-11:01:45 firemin-1 ha_daemon[3262]: id="38A1" severity="warn" sys="System" sub="ha" name="Current load average 13.88 is high!"
    2010:10:20-11:02:48 firemin-1 ha_daemon[3262]: id="38A1" severity="warn" sys="System" sub="ha" name="Current load average 11.21 is high!"
    2010:10:20-11:03:50 firemin-1 ha_daemon[3262]: id="38A1" severity="warn" sys="System" sub="ha" name="Current load average 12.17 is high!"
    2010:10:20-11:03:51 firemin-2 ha_daemon[3217]: id="38A1" severity="warn" sys="System" sub="ha" name="Current load average 12.17 of node 1 is high, please check you system!"


    And this:
    2010:10:20-10:57:09 firemin-1 slon[24129]: [2-1] ERROR  cannot get sl_local_node_id - ERROR:  schema "_asg_cluster" does not exist

    I had this kind of problem other 4 times in the past, look img9, always it wasn't reported by hardware log as a high cpu usage but as a system fail ( interruption  )
  • You really need to see what top says when you're seeing the error messages in the HA live log.

    Cheers - Bob
  • Looking the process list with ssh connection I've found POSTGRES process using high CPU resources.
    In the screenshot you can see it useing just 38% but I've seen it on max of 45%.

    In the system messages log I've found this:
    2010:10:21-10:15:11 firemin-1 postgres[13009]: [3-1] LOG:  unexpected EOF on client connection
    2010:10:21-10:15:14 firemin-1 postgres[13265]: [3-1] ERROR:  duplicate key value violates unique constraint "primary_l"
    2010:10:21-10:17:00 firemin-1 postgres[13531]: [3-1] LOG:  unexpected EOF on client connection

    If I take a look into system messages log file of yesterday I see a lot of Database activity when I've got the problem.
    Maybe is necessary do some Database maintenance activity?
  • I was guessing that the culprit was PostgreSQL.  The "unexpected EOF on client connection" is "normal" - it's an example of messages used by the developers to debug their code, but has no meaning for admins.  I don't think the "duplicate key value" message is that unusual either.  The one thing you might try is reducing the number of months you keep reporting data (Reporting >> Settings).  

    Cheers - Bob
  • today my configuration have a lot of problems...
    The slave ASG320  is sending a lot of alert like this:

    HA confd sync daemon not running - restarted
    -- 
    HA Status          : HA SLAVE (node id: 2)
    System Uptime      : 43 days 16 hours 26 minutes
    System Load        : 0.22
    System Version     : Astaro Security Gateway Appliance 7.507

    Once every hour  !
  • Please let us know the fix after Astaro Support helps you.

    Cheers - Bob
  • hi there, my problem was not solved ;Astaro support instal some monitoring scripts  on my cluster and then suggest to me to plan an upgrade to Astaro 8.
    New kernel, more optimizations, more efficiency and so on...
    I will tray !
  • Before upgrading to V8, I believe you should ask Astaro Support to escalate your issue, and that the developers likely will be interested.

    Cheers - Bob
  • Having the same problem here in an active/active cluster environment. Same log error messages.  High cpu even with shutting down many of the services and reducing reporting periods. Not sure what to do at this point.