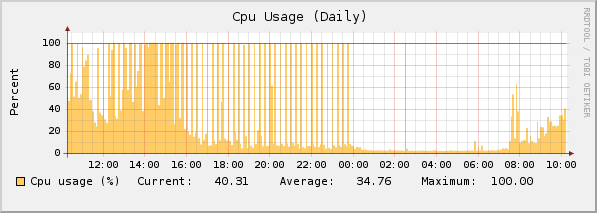
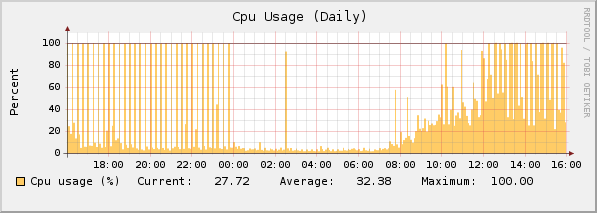
I have problem with CPU LOAD on ASG320 with 7.400 version.
My Process List:
where you can find proces use about 40% CPU
USER       PID %CPU %MEM    VSZ   RSS TTY      STAT START   TIME COMMAND
root         1  0.0  0.0    720   280 ?        S    Feb27   0:01 init [3]
root         2  0.0  0.0      0     0 ?        RN   Feb27   0:00 [ksoftirqd/0]
root         3  0.0  0.0      0     0 ?        S
root     22039  0.0  1.4  30888 15392 ?        R    15:23   0:00      \_ confd [worker[:P]rpc]
root      2902  0.0  1.0  13692 10652 ?        Ss   Feb27   6:09 dns-resolver.plx
root      2936  0.0  0.5   8172  5244 ?        S    Feb27   0:14 /usr/local/bin/sysmond
root      3012  0.0  0.9  15816 10204 ?        Ss   Feb27   0:01 /var/aua/aua.bin
root     21703  0.1  0.0      0     0 ?        Z    15:23   0:00  \_ [aua.bin]
root      3018  0.0  1.2  19364 13248 ?        S    Feb27   5:32 /usr/local/bin/notifier.plx
root      3054  0.0  0.0   1804   712 ?        Ss   Feb27   0:00 /usr/sbin/cron
root     20354  0.0  0.0   1828   560 ?        S    15:17   0:00  \_ /usr/sbin/cron
root     20355  0.0  1.2  16308 12680 ?        SNs  15:17   0:00      \_ /usr/local/bin/gen_inline_reporting_data.plx
root      3119  0.0  0.0   1760   448 ?        Ss   Feb27   0:00 /usr/local/bin/asg_ha_zeroconf
postgres  3144  0.0  0.5  48812  5348 ?        S    Feb27   0:04 /usr/bin/postgres -D /var/storage/pgsql/data
postgres  3150  0.0  3.3  48948 34944 ?        Ss   Feb27   0:03  \_ postgres: writer process
postgres  3151  0.0  0.1  48812  1040 ?        Ss   Feb27   0:03  \_ postgres: wal writer process
postgres  3152  0.0  0.1  49108  1344 ?        Ss   Feb27   0:00  \_ postgres: autovacuum launcher process
postgres  3153  0.0  0.1   6964  1068 ?        Ss   Feb27   0:08  \_ postgres: stats collector process
postgres  3997  0.1  3.6  49636 37036 ?        Ss   Feb27  10:57  \_ postgres: reporting reporting [local] idle
postgres  4282  0.0  3.2  50040 33448 ?        Ss   Feb27   0:07  \_ postgres: postgres smtp 127.0.0.1(38821) idle
postgres 20358 38.2  5.4  88708 56136 ?        Rs   15:17   2:38  \_ postgres: reporting reporting [local] SELECT
postgres 21515  0.1  0.4  50024  4640 ?        Ss   15:21   0:00  \_ postgres: postgres smtp 127.0.0.1(51058) idle
root      3195  0.0  6.8  73104 69940 ?        S    Feb27   0:30 /var/mdw/mdw_daemon.plx
root      3220  0.1  0.8  14152  8856 ?        S    Feb27   7:21 /usr/local/bin/selfmonng.plx
root      3255  0.0  0.6  13552  6340 ?        S    Feb27   0:00  \_ [timewarp check]
root     21133  0.0  0.1   2520  1108 ?        S    Mar01   0:00  \_ /bin/bash /usr/bin/ctasd_connect_check.sh
root     21136  0.0  0.1   3332  1232 ?        S    Mar01   0:00      \_ /tmp/ctasd -q --timeout=5 --tries=1 http://resolver1.ast.ct
root      3227  0.0  0.0   1500   512 ?        Ss   Feb27   0:00 /usr/local/bin/daemon-watcher selfmonng.plx /usr/local/bin/selfmonn
root      3228  0.0  0.0   1708   676 tty1     Ss+  Feb27   0:00 /sbin/mingetty --noclear --no-hostname tty1
root      3229  0.0  0.0   1708   656 tty2     Ss+  Feb27   0:00 /sbin/mingetty --no-hostname tty2
root      3230  0.0  0.0   1708   660 tty3     Ss+  Feb27   0:00 /sbin/mingetty --no-hostname tty3
root      3231  0.0  0.0   1712   660 tty4     Ss+  Feb27   0:00 /sbin/mingetty --no-hostname tty4
root      3256  0.4  0.2   3904  2272 ?        S
"postgres 20358 38.2 5.4 88708 56136 ? Rs 15:17 2:38 \_ postgres: reporting reporting [local] SELECT"
Do you have more CPU load like me, too?
Regards,
WaMaR
This thread was automatically locked due to age.