Give it time, you will see a dark line. I can confirm this feature works. I wish my graph was like that. I clear about a GB of logs a day before compression, my logs are all over the place [:)]
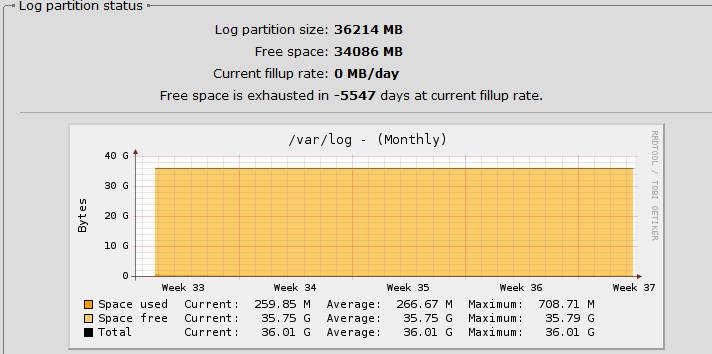
See the attached screen grab. Anyone else seen this? Or is the graph just broken?
The _graph_ looks perfectly fine to me, what am I missing?
What doesn't look right is the negative time estimation for disk fill-up. To provide a more exact estimation right after the machine has been installed, the disk size after the installation is taken into account and works as a baseline; if you start with 250MB space used after installation, you did not fill it in those 5 minutes since system restart, and you won't continue to fill your disk with 50MB/minute. To avoid that miscalculation, the installation size is taken as baseline. Now what happened to you is that your current partition usage is _below_ the baseline value, but the question is why that happened.
How long is your machine running since installation? Did you do a factory reset? Did you delete/move anything manually? What is the modification time of /etc/initial_usage_correction ?
Andreas the negative days thing happens to me also.
Also easch morning I look at my log report and it tells me I use about 14 MB a day. I wish. My Content Filter when compressed is 80 MB alone. This feature is broken and needs looking at
BarryG: It is not the PF log that is huge, it is the Content Filter log.
We have about 3,000 nodes hitting it everyday. Our stats are about:
800MB just on our content filter each day before it compresses.
Around 70GB of internet bandwidth each day..
On average 6,000 concurrent connections
Around 100 million packets hit the boxes each day.
This is why it is so painful when Astaro get their up2dates rong or stuff up pattern information, which is still not updated on our servers yet!!!
If you provide the following information, I might be able to figure out the problem and fix it along the way...
How long is your machine running since installation? Did you do a factory reset? Did you delete/move anything manually? What is the modification time of /etc/initial_usage_correction ?
Sorry everyone ... the issue was to do with the negative value at the top of the graph and the fact that the graph does not change despite the log partition filling up.
ASG320 + 7.007
Uptime: 48d 13h 35m
No factory reset
Had to butcher the web reporting because it was completely broken (but that was just deleting PNGs and running a few scripts). In the end manual intervention didn't help and problem was solved when the units rebooted as a result of a firmware update
fw0:/root # ls -l /etc/initial_usage_correction
-rw-rw-rw- 1 root root 88 Mar 29 12:01 /etc/initial_usage_correction


