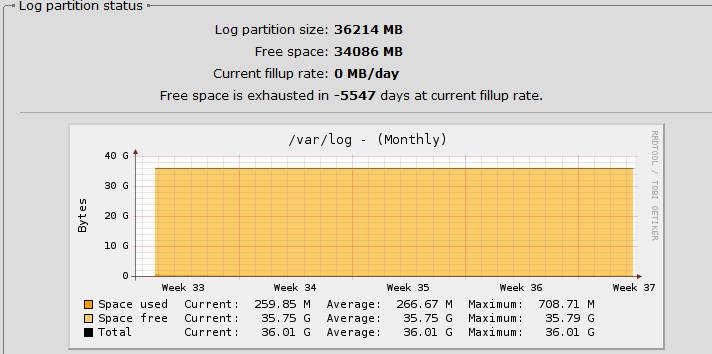
See the attached screen grab. Anyone else seen this? Or is the graph just broken?
The _graph_ looks perfectly fine to me, what am I missing?
What doesn't look right is the negative time estimation for disk fill-up. To provide a more exact estimation right after the machine has been installed, the disk size after the installation is taken into account and works as a baseline; if you start with 250MB space used after installation, you did not fill it in those 5 minutes since system restart, and you won't continue to fill your disk with 50MB/minute. To avoid that miscalculation, the installation size is taken as baseline. Now what happened to you is that your current partition usage is _below_ the baseline value, but the question is why that happened.
How long is your machine running since installation? Did you do a factory reset? Did you delete/move anything manually? What is the modification time of /etc/initial_usage_correction ?
If you provide the following information, I might be able to figure out the problem and fix it along the way...
How long is your machine running since installation? Did you do a factory reset? Did you delete/move anything manually? What is the modification time of /etc/initial_usage_correction ?
If you provide the following information, I might be able to figure out the problem and fix it along the way...
How long is your machine running since installation? Did you do a factory reset? Did you delete/move anything manually? What is the modification time of /etc/initial_usage_correction ?
Sorry everyone ... the issue was to do with the negative value at the top of the graph and the fact that the graph does not change despite the log partition filling up.
ASG320 + 7.007
Uptime: 48d 13h 35m
No factory reset
Had to butcher the web reporting because it was completely broken (but that was just deleting PNGs and running a few scripts). In the end manual intervention didn't help and problem was solved when the units rebooted as a result of a firmware update
fw0:/root # ls -l /etc/initial_usage_correction
-rw-rw-rw- 1 root root 88 Mar 29 12:01 /etc/initial_usage_correction
Hi Andreas,
Sorry everyone ... the issue was to do with the negative value at the top of the graph and the fact that the graph does not change despite the log partition filling up.
-rw-rw-rw- 1 root root 88 Mar 29 12:01 /etc/initial_usage_correction
James, the df of your log partition says the same like the graph does - usage of 264MB on a 40gig partition won't be noticeable much. So as far as I can see, the graph is OK.
As to the negative fillup estimation: I think that at the point where the initial usage correction was determined the log partition usage was higher than it was now, therefore leading to a negative estimation.
Can you please verify this by checking the contents of the initial usage correction file with this command?
perl -e 'use Storable; use Data:[:D]umper; my $data = retrieve("/etc/initial_usage_correction"); print Dumper($data); '
This file contains the initial partition usage in blocks, which is used as a baseline when computing the fillup rate. It is usually created right after installation.


