

Hi there!
I'm trying to understand the "E-Mail Protection Statistics Graph".
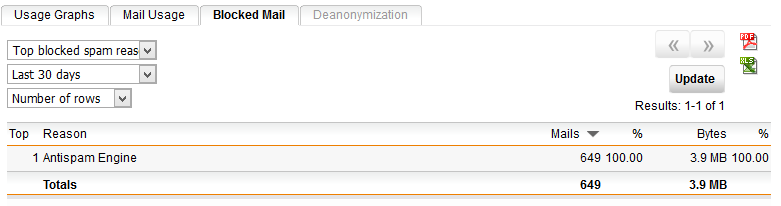
Have a look at the attached pictures. There are over 600 blocked spam mails, but the statistics only shows 58 total processed mails?
Can somebody explain?
Kind regards
This thread was automatically locked due to age.
