This discussion has been locked.
You can no longer post new replies to this discussion. If you have a question you can start a new discussion

[Solved]After update 9.203-3 high CPU load

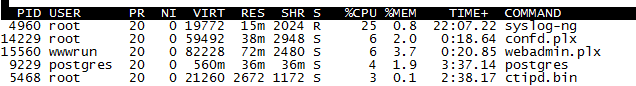
After the update I noticed that my UTM 220 HA-Cluster has 98% CPU load (shown in the dash), but only on the master node (the slave node behaves as ususal). When I switch roles by rebooting the master the other node goes up to 98% load, while the other one does not have the high load anymore. Output of TOP command: see attached screenshot. The deamon syslog-ng shows a constant 25% load which is not normal I guess.

Anybody else experiencing this problem? Is this maybe caused by a switch to a new syslog deamon which now goes through the old logs and generates metadata or something? The firewall UI and internet traffic appears to be as responsive as before, so no crazy uncontrolled CPU hogging is going on.


This thread was automatically locked due to age.
Parents
  • Looked at it further. The "System messages" log gets bombarded with the following entries:


    2014:06:23-10:11:44 GwExt01-2 postgres[1519]: [3-1] ERROR: cache lookup failed for function 411182
    2014:06:23-10:11:44 GwExt01-2 postgres[1519]: [3-2] STATEMENT: select ins_atp($1, $2, $3::int4, $4, $5, $6, $7, $8, $9, $10, $11::int4) 


    This and the tip of BAlfson to rebuild the PostgreSQL DB lead me to execute the following command:
    /etc/init.d/postgresql92 rebuild 

    After that I got a missmatching Database ID error between slave and master node of my HA cluster. Makes sense, as the database is only rebuilt on the master and the slave still has the old copy stored. So I rebooted the slave node and waited for the sync to complete. CPU load is now back to normal. BUT: I now get the following error in system messages and RAM usage has rocketed to 83% (constant):

    2014:06:23-11:26:42 GwExt01-2 postgres[18419]: [116-1] ERROR: schema "repmgr_asg" does not exist at character 13 
    2014:06:23-11:26:42 GwExt01-2 postgres[18419]: [116-2] STATEMENT: insert into repmgr_asg.repl_monitor ( 
    2014:06:23-11:26:42 GwExt01-2 postgres[18419]: [116-3] primary_node, standby_node, 
    2014:06:23-11:26:42 GwExt01-2 postgres[18419]: [116-4] last_monitor_time, 
    2014:06:23-11:26:42 GwExt01-2 postgres[18419]: [116-5] last_wal_primary_location, last_wal_standby_location, 
    2014:06:23-11:26:42 GwExt01-2 postgres[18419]: [116-6] replication_lag, apply_lag 
    2014:06:23-11:26:42 GwExt01-2 postgres[18419]: [116-7] ) values ( $1, $2, $3, $4, $5, pg_xlog_location_diff($4, $5), pg_xlog_location_diff($4, $6)) 


    What does this error message even say? Does this mean replication between slave / master is broken at the moment?
    HA Log:

    2014:06:23-11:45:48 GwExt01-1 repctld[4661]: [c] sql_execute(2234): SQL execute: ERROR: schema "repmgr_asg" does not exist
    2014:06:23-11:45:48 GwExt01-1 repctld[4661]: [c] update_monitor(1663): MONITOR: insert failed 


    What should I try next? Maybe rejoining the slave to the cluster?
Reply
  • Looked at it further. The "System messages" log gets bombarded with the following entries:


    2014:06:23-10:11:44 GwExt01-2 postgres[1519]: [3-1] ERROR: cache lookup failed for function 411182
    2014:06:23-10:11:44 GwExt01-2 postgres[1519]: [3-2] STATEMENT: select ins_atp($1, $2, $3::int4, $4, $5, $6, $7, $8, $9, $10, $11::int4) 


    This and the tip of BAlfson to rebuild the PostgreSQL DB lead me to execute the following command:
    /etc/init.d/postgresql92 rebuild 

    After that I got a missmatching Database ID error between slave and master node of my HA cluster. Makes sense, as the database is only rebuilt on the master and the slave still has the old copy stored. So I rebooted the slave node and waited for the sync to complete. CPU load is now back to normal. BUT: I now get the following error in system messages and RAM usage has rocketed to 83% (constant):

    2014:06:23-11:26:42 GwExt01-2 postgres[18419]: [116-1] ERROR: schema "repmgr_asg" does not exist at character 13 
    2014:06:23-11:26:42 GwExt01-2 postgres[18419]: [116-2] STATEMENT: insert into repmgr_asg.repl_monitor ( 
    2014:06:23-11:26:42 GwExt01-2 postgres[18419]: [116-3] primary_node, standby_node, 
    2014:06:23-11:26:42 GwExt01-2 postgres[18419]: [116-4] last_monitor_time, 
    2014:06:23-11:26:42 GwExt01-2 postgres[18419]: [116-5] last_wal_primary_location, last_wal_standby_location, 
    2014:06:23-11:26:42 GwExt01-2 postgres[18419]: [116-6] replication_lag, apply_lag 
    2014:06:23-11:26:42 GwExt01-2 postgres[18419]: [116-7] ) values ( $1, $2, $3, $4, $5, pg_xlog_location_diff($4, $5), pg_xlog_location_diff($4, $6)) 


    What does this error message even say? Does this mean replication between slave / master is broken at the moment?
    HA Log:

    2014:06:23-11:45:48 GwExt01-1 repctld[4661]: [c] sql_execute(2234): SQL execute: ERROR: schema "repmgr_asg" does not exist
    2014:06:23-11:45:48 GwExt01-1 repctld[4661]: [c] update_monitor(1663): MONITOR: insert failed 


    What should I try next? Maybe rejoining the slave to the cluster?
Children
No Data