This discussion has been locked.
You can no longer post new replies to this discussion. If you have a question you can start a new discussion

ASG 8.305 High CPU usage

CPU usage has been spiking every day for a while (see attached).  Usually sits around ~80-99% usage.  

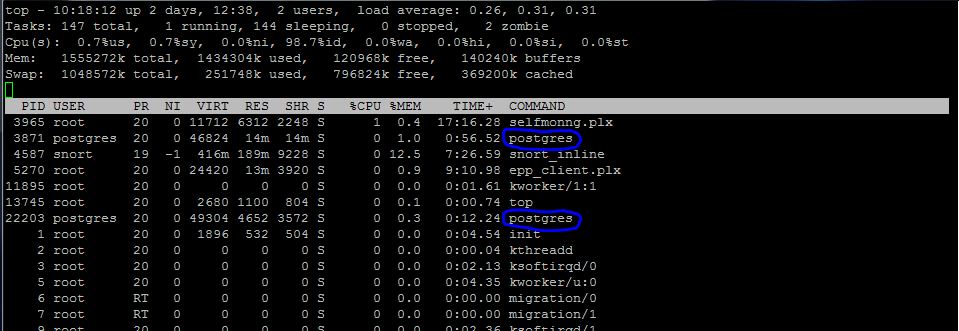
Not seeing anything standing out on the process list that is making it sit at 99% right when I looked at the process list...
USER       PID %CPU %MEM    VSZ   RSS TTY      STAT START   TIME COMMAND

root         2  0.0  0.0      0     0 ?        S    Sep18   0:00 [kthreadd]
root         3  0.0  0.0      0     0 ?        S    Sep18   0:03  \_ [migration/0]
root         4  0.0  0.0      0     0 ?        S    Sep18  29:42  \_ [ksoftirqd/0]
root         5  0.0  0.0      0     0 ?        S    Sep18   0:03  \_ [migration/1]
root         6  0.0  0.0      0     0 ?        S    Sep18  10:15  \_ [ksoftirqd/1]
root         7  0.1  0.0      0     0 ?        S    Sep18 132:56  \_ [events/0]
root         8  0.0  0.0      0     0 ?        S    Sep18  36:05  \_ [events/1]
root         9  0.0  0.0      0     0 ?        S    Sep18   0:00  \_ [khelper]
root        14  0.0  0.0      0     0 ?        S    Sep18   0:00  \_ [async/mgr]
root        15  0.0  0.0      0     0 ?        S    Sep18   0:00  \_ [pm]
root        81  0.0  0.0      0     0 ?        S    Sep18   0:04  \_ [sync_supers]
root        83  0.0  0.0      0     0 ?        S    Sep18   0:07  \_ [bdi-default]
root        85  0.0  0.0      0     0 ?        S    Sep18   0:07  \_ [kblockd/0]
root        86  0.0  0.0      0     0 ?        S    Sep18   0:06  \_ [kblockd/1]
root        88  0.0  0.0      0     0 ?        S    Sep18   0:00  \_ [kacpid]
root        89  0.0  0.0      0     0 ?        S    Sep18   0:00  \_ [kacpi_notify]
root        90  0.0  0.0      0     0 ?        S    Sep18   0:00  \_ [kacpi_hotplug]
root       207  0.0  0.0      0     0 ?        S    Sep18   0:00  \_ [ksuspend_usbd]
root       211  0.0  0.0      0     0 ?        S    Sep18   0:00  \_ [khubd]
root       214  0.0  0.0      0     0 ?        S    Sep18   0:00  \_ [kseriod]
root       247  0.0  0.0      0     0 ?        S    Sep18   0:00  \_ [kondemand/0]
root       248  0.0  0.0      0     0 ?        S    Sep18   0:00  \_ [kondemand/1]
root       272  0.0  0.0      0     0 ?        S    Sep18   4:27  \_ [kswapd0]
root       273  0.0  0.0      0     0 ?        S    Sep18   0:00  \_ [aio/0]
root       274  0.0  0.0      0     0 ?        S    Sep18   0:00  \_ [aio/1]
root       275  0.0  0.0      0     0 ?        S    Sep18   0:00  \_ [crypto/0]
root       276  0.0  0.0      0     0 ?        S    Sep18   0:00  \_ [crypto/1]
root       951  0.0  0.0      0     0 ?        S    Sep18   0:08  \_ [redd/0]
root       952  0.0  0.0      0     0 ?        S    Sep18   0:08  \_ [redd/1]
root       972  0.0  0.0      0     0 ?        S    Sep18   0:00  \_ [edac-poller]
root      1034  0.0  0.0      0     0 ?        S    Sep18   0:00  \_ [ata/0]
root      1035  0.0  0.0      0     0 ?        S    Sep18   0:00  \_ [ata/1]
root      1036  0.0  0.0      0     0 ?        S    Sep18   0:00  \_ [ata_aux]
root      1041  0.0  0.0      0     0 ?        S    Sep18   0:00  \_ [scsi_eh_0]
root      1044  0.0  0.0      0     0 ?        S    Sep18   0:00  \_ [scsi_eh_1]
root      1047  0.0  0.0      0     0 ?        S    Sep18   0:00  \_ [scsi_eh_2]
root      1050  0.0  0.0      0     0 ?        S    Sep18   0:00  \_ [scsi_eh_3]
root      1064  0.0  0.0      0     0 ?        S    Sep18   0:00  \_ [scsi_eh_4]
root      1067  0.0  0.0      0     0 ?        S    Sep18   0:00  \_ [scsi_eh_5]
root      3106  0.0  0.0      0     0 ?        D    Sep18   1:47  \_ [kjournald]
root      3112  0.0  0.0      0     0 ?        D    Sep18   9:42  \_ [flush-8:0]
root      4430  0.0  0.0      0     0 ?        S    Sep18   0:00  \_ [kjournald]
root      4431  0.0  0.0      0     0 ?        D    Sep18   7:16  \_ [kjournald]
root      4432  0.0  0.0      0     0 ?        D    Sep18  52:53  \_ [kjournald]
root      4433  0.0  0.0      0     0 ?        D    Sep18   0:53  \_ [kjournald]
root      4495  0.0  0.0      0     0 ?        S    Sep18   0:00  \_ [kauditd]
root         1  0.0  0.0   1816   548 ?        Ss   Sep18   0:36 init [3]  
root      3172  0.0  0.0   2244   452 ?        S

^^^ continues on second post (char limit)


Again, not seeing anything via shell (top) either (see attached)


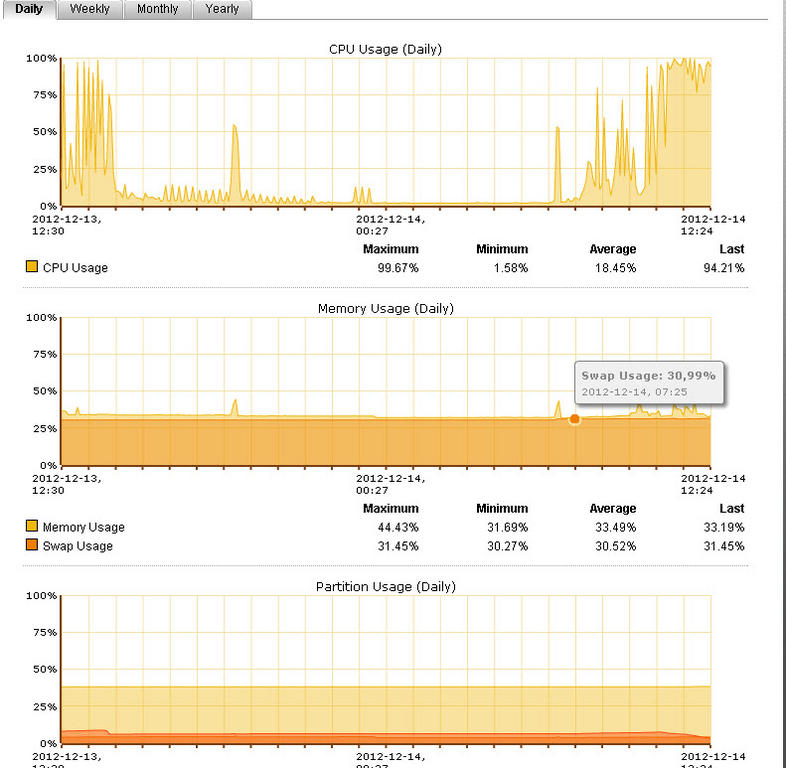
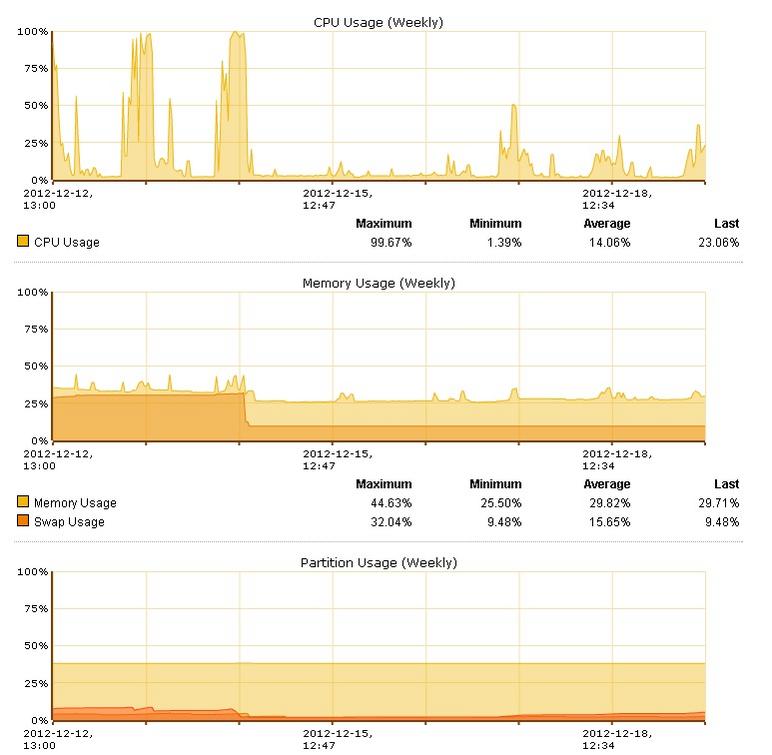
Anyone have any idea why it would be spiking and not lowering for hours on end?


This thread was automatically locked due to age.
  • part 2 of process list:

    wwwrun   11956  0.0  0.0   7684  2608 ?        S    12:26   0:00  \_ /bin/httpd -f /etc/httpd/httpd.conf
    
    root      6508  0.0  0.2  30784 10128 ?        Ss   Sep18  81:13 smtpd [master]
    root      6625  0.0  0.6  49360 24500 ?        S    Sep18  12:44  \_ smtpd [queue manager]
    chroot    6810  0.0  0.0   8224  2112 ?        S    Sep18  10:01  \_ /bin/exim -DINPUT -bdf
    root     12109  0.1  0.4  34700 16112 ?        S    12:28   0:00  \_ smtpd [scanner]
    root      6758  0.0  0.1  35836  7340 ?        Ssl  Sep18  19:27 ./ctipd.bin -l /usr/lib/ctipd
    root      6887  0.0  0.1  14784  4356 ?        Ss   Sep18   0:38 /usr/libexec/postfix/master
    postfix   7083  0.0  0.0   6024  1600 ?        S    11:39   0:00  \_ pickup -l -t fifo -u -c
    postfix   7084  0.0  0.0   6080  1688 ?        S    11:39   0:00  \_ qmgr -l -t fifo -u -c
    root      7007  0.0  0.0   2212   212 ?        Ss   Sep18   0:00 /usr/libexec/ipsec/starter
    root      7009  0.0  0.0  24940  1236 ?        Ss   Sep18   6:59  \_ /usr/libexec/ipsec/pluto --nofork --debug-none --nocrsend --nat
    root      7294  0.0  0.0   1776    28 ?        S    Sep18   0:00      \_ _pluto_adns
    root      3947  0.0  0.0   5184  1244 ?        Ss   Sep20   0:16 /sbin/openvpn --config /etc/openvpn/openvpn.conf --writepid /var/ru
    snort    20828  3.9  7.9 553988 320588 ?       S
    root      1885  0.0  0.1  15412  5572 ?        S    Nov28   0:00 /var/aua/aua.bin
    root      6140  0.0  0.0      0     0 ?        Z    11:32   0:00  \_ [aua.bin] 
    root      6298  0.2  0.1   8780  5960 ?        S
  • What are hardware specs?  What are usage levels?  When did these problems start?

    Cheers - Bob
     
    Sophos UTM Community Moderator
    Sophos Certified Architect - UTM
    Sophos Certified Engineer - XG
    Gold Solution Partner since 2005
    MediaSoft, Inc. USA
  • First you should check your reporting settings, most of the performance issues are from the reporting. How big is the database ? ( du -h /var/log/reporting)

    Cheers
  • Log into shell and run'top' when you see this happening; the offending process should be readily apparent.

    CTO, Convergent Information Security Solutions, LLC

    https://www.convergesecurity.com

    Advice given as posted on this forum does not construe a support relationship or other relationship with Convergent Information Security Solutions, LLC or its subsidiaries.  Use the advice given at your own risk.

  • Log into shell and run'top' when you see this happening; the offending process should be readily apparent.
    I would prefer 'top -c'. With the option -c you can see the whole command.
  • Seems it was the reporting; rebuild the database ( How to recreate a postgres database: Astaro Security Gateway ) and lowered the reporting settings and has been topping out at ~30-40% cpu usage at peak hours compared to the 99% spikes.

    Memory usage also dropped.  See attached to see the difference since I made the changes.


    Thanks for the support.