This discussion has been locked.
You can no longer post new replies to this discussion. If you have a question you can start a new discussion

[7.101] Asg320 - 100% Cpu

Hi all,

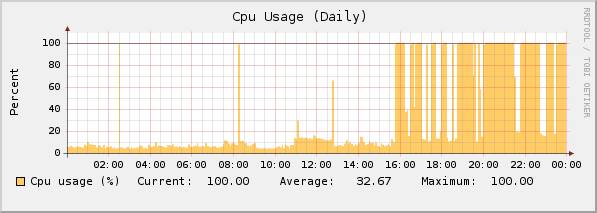
I've got an ASG320 in production that periodically hits 100% for extended periods during the day (well that's what Executive Report claims).

Whenever I SSH into it I can't find the evil process (but I would suspect either HTTP proxy or mysql).

I've only got 250 users behind the unit on an 8Mbps link and it strikes me as odd that the unit could get pegged so easily.

Any suggestions? I tried all the usual turn off caching, single virus scan etc. to no avail. Turn off accounting?

Cheers,

James


This thread was automatically locked due to age.
Parents
  • What does running "top" reveal when you SSH into the system when the CPU is pegged?  by default TOP will show the top CPU-consuming process at the top of its list when run.

    CTO, Convergent Information Security Solutions, LLC

    https://www.convergesecurity.com

    Advice given as posted on this forum does not construe a support relationship or other relationship with Convergent Information Security Solutions, LLC or its subsidiaries.  Use the advice given at your own risk.

  • I have a similar message the two processes that never seem to stop working when mine gets pegged are mysql and ulogd (what is that?).  Any ideas?  I usually end up terminating them, and then the monitor restarts them.
Reply Children
  • I have a similar message the two processes that never seem to stop working when mine gets pegged are mysql and ulogd (what is that?).  Any ideas?  I usually end up terminating them, and then the monitor restarts them.


    Sounds like the accounting files are corrupt, or your hardware can't handle processing them.  Try Disabling accounting under the Network menu.

    CTO, Convergent Information Security Solutions, LLC

    https://www.convergesecurity.com

    Advice given as posted on this forum does not construe a support relationship or other relationship with Convergent Information Security Solutions, LLC or its subsidiaries.  Use the advice given at your own risk.

  • The ulogd ist the User Log Daemon. 
    you can renew the  accounting db, this should solve the problem with the ulogd.

    move the old accounting.db to accounting.db.bak and than restart the ulogd.
  • Sorry for not replying sooner. I finally pinned the process down. Get's upto 100% for extended periods.

    root      3089  0.0  0.0   1804   712 ?        Ss   Jan11   0:00 /usr/sbin/cron
    root     19466  0.0  0.0   1828   560 ?        S    16:45   0:00  \_ /usr/sbin/cron
    root     19467 34.1  1.4  16372 14620 ?        DNs  16:45   0:46      \_ /usr/bin/perl /usr/local/bin/gen_inline_reporting_data.pl
  • Is that the IPS reporter?

    Barry
  • I'm not sure. This bunch of processes also stress the box regularly (after further monitoring). So it looks like all the logging and reporting is killing this ASG ... what can I do?

    root      2567  0.0  0.2   3108  2068 ?        Ss   Jan11   8:36 /sbin/syslog-ng -f /etc/syslog-ng.conf
    root     31569  0.2  0.7  10424  7812 ?        Ss   00:00   1:27  \_ /usr/bin/perl /usr/local/bin/reporter/websec-reporter.pl
    root     31570  0.0  0.6   9028  6416 ?        Ss   00:00   0:00  \_ /usr/bin/perl /usr/local/bin/reporter/mailsec-reporter.pl
    root     31571  0.0  0.4   6612  4188 ?        Ss   00:00   0:00  \_ /usr/bin/perl /usr/local/bin/reporter/vpn-reporter.pl
    root     31572 28.4  2.5  28188 25716 ?        Rs   00:00 184:50  \_ /usr/bin/perl /usr/local/bin/reporter/ips-reporter.pl
    root     31573  0.0  0.7  10088  7540 ?        Ss   00:00   0:17  \_ /usr/bin/perl /usr/local/bin/reporter/pfilter-reporter.pl
    root     31574  0.0  0.6   8136  6388 ?        Ss   00:00   0:01  \_ /usr/bin/perl /usr/local/bin/reporter/admin-reporter.pl
    root     31575  0.0  0.9  15292 10168 ?        Ss   00:00   0:00  \_ /usr/local/bin/notifier.plx
  • I've got several customers running 320 units and none of them are having performance problems... how much traffic / how many users are you pushing through this box?  what features are enabled?

    It's normal to see those reporter.pl processes spike the processor briefly (I think they run every 15 minutes or so), but on the systems I manage they never stay active long... the load remains below 1.0 99.9% of the time.

    CTO, Convergent Information Security Solutions, LLC

    https://www.convergesecurity.com

    Advice given as posted on this forum does not construe a support relationship or other relationship with Convergent Information Security Solutions, LLC or its subsidiaries.  Use the advice given at your own risk.

  • The unit is running in bridging mode. It filtering traffic on a WiFi hotspot in Cambridge. Upto 500 users via 4 access points. MAC blocking/auth is done by a MirokTik. I've got a Cisco 2600 series in front of it with 4 x 2048/256 ADSL links. So it's:

    WiFi -> MikroTik -> ASG -> Cisco

    See the CPU graph attached.
  • So, what features are activated?  IPS, Packet Filter, etc...

    with that many users with that much bandwidth... I'd like to see the bandwidth usage graphs... wanna bet that they coincide with that CPU graph?  It might just be that that much raw traffic is overwhelming that unit...  it appears it all happens after 4:00PM...

    You may want to talk to your reseller about adding RAM to that system.

    CTO, Convergent Information Security Solutions, LLC

    https://www.convergesecurity.com

    Advice given as posted on this forum does not construe a support relationship or other relationship with Convergent Information Security Solutions, LLC or its subsidiaries.  Use the advice given at your own risk.

  • The following is active: Firewall, IPS, HTTP Proxy, A/V for HTTP, Anti-Spyware.

    There's 1GB of RAM in the 320.

    See the memory and bandwidth graphs below. I'm not quite sure how to read the br0 graph but I presume it's cumulative across all bridge interfaces.

    I think this is just the syslogging and reporting going berserk. I'll put in a ticket?
  • You can try starting a case with support, see what they think...  You might just need a faster piece of hardware altogether, especially with all those features enabled.  There's a possibility that something else could be awry, of course.  Have you tried disabling accounting (under the Network Menu)?  It may be that there's simply not enough CPU horsepower to handle all those features -- let support take a crack at it.  You may need to move to a faster piece of hardware.

    CTO, Convergent Information Security Solutions, LLC

    https://www.convergesecurity.com

    Advice given as posted on this forum does not construe a support relationship or other relationship with Convergent Information Security Solutions, LLC or its subsidiaries.  Use the advice given at your own risk.