

Hey guys,
I'd like to ask you for help on an incident we had today with our SG230. We switched from a WatchGuard to Sophos about 4 weeks ago and use most of the features, like Email-, Web- and Webserverprotection.
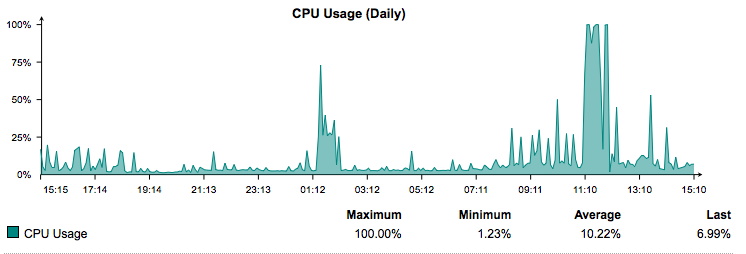
We normally see a CPU utilization of 10-25% with very few peaks up to 80-90 %. Today, around 11:00, we suddenly had a constant CPU utilization of 100%, which caused most of the inbound and outbound connections to time out. We then did a HA-failover, that cleared things up for 10 minutes, when the problems started coming back. With another HA-failover everything is back to normal.
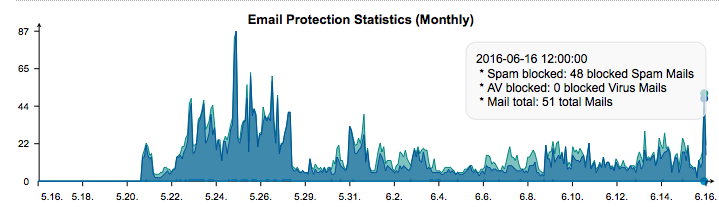
I don't see anything unsual in the feature individual logs, we only had a significant peak in the number of spam mails (we are talking about ~50 Spam mails).
I can't believe, that this number of spam mails might have caused such a high CPU load...
Here's our monthly email statistics:
Here are our CPU statistics for today:
So, we are looking for a way to toubleshoot todays incident. I found a knowledgebase article at Sophos about how to identify the top 20 CPU consuming processes: https://www.sophos.com/de-de/support/knowledgebase/115767.aspx
As we are now back to normal, that does not help me now. Is there any way to clearly identify, which process / feature went berserk this morning?
Firmware version is: 9.402-7
Thanks in advance for any advice and best regards from Germany
This thread was automatically locked due to age.

