This discussion has been locked.
You can no longer post new replies to this discussion. If you have a question you can start a new discussion

UTM Virtual Appliance Performance

Hello,

We have a single UTM virtual appliance, and I am wondering if anyone else can confirm the performance that they are getting from a UTM virtual appliance?

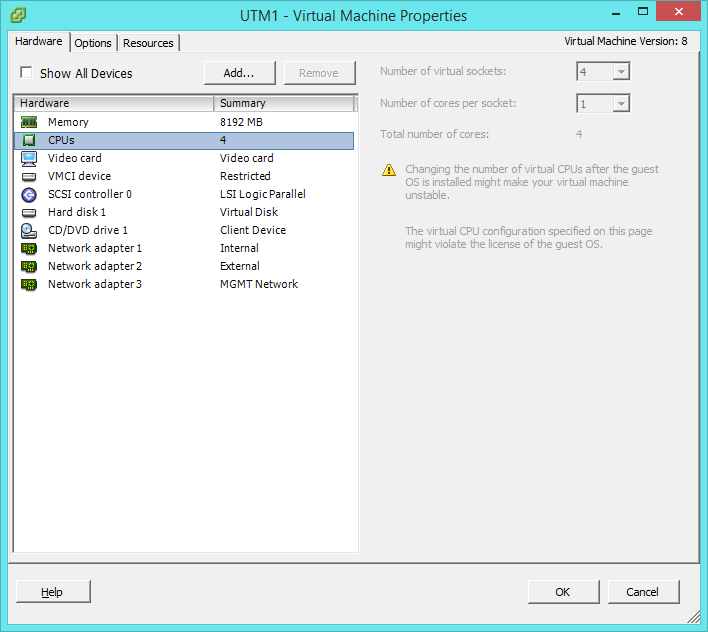
I have it running on ESXi 5.1 and I have given it 8 cores on a server with an E5430 2.66 processor, along with 8GB of memory.

From what I can tell, it does use all of the cores, but the http proxy service on the utm only uses 2 cores.  This is monitored via TOP from the console.  I have also been told from support that the linux kernel is 64 bit, but the http proxy service is only 32bit.

We have a 100Mbps internet pipe and about 2000 users at about 8000 connections / sec.  This results in 2 cores pinned on the UTM for most of the day, depending on the types of traffic.  We are not using ssl scanning at all, just plain old transparent mode/proxy web filtering.  No other services other than web filtering and application control.

Thanks,
Dan.


This thread was automatically locked due to age.
  • so i would tell vmware to configure the utm vm with 4 vcpus max.put up a top when the machine is under heavy load similar to mine.  we need to see what else is going on other than only http proxy.  I'm willing to bet your machine actually only had a single QC cpu.  vmware was set to oversub to 8 and pass that to the vm.  http proxy only had two vcpus available when it's under load and the other two are either not being used at all or are also overloaded with something else.  This isn't a utm software limitation it is either the hardware isn't big enough to handle the load or your vmware is misconfigured.
  • I'd also strongly recommend reading this KB article: VMware KB: Troubleshooting ESX/ESXi virtual machine performance issues

    Look at the CPU constraints section of that article and the CPU Ready performance numbers. VMware has indicated that in many cases, guests running 2 vCPU's often out perform guests with 4 vCPU allocations because of CPU scheduling issues. PCU scheduling issues will show as higher CPU Ready % values in ESXi performance counters.

    Also, Is this server a dual socket server? The E5450 Xeon only has four cores to play with and no Hyperthreading in that era so unless you have populated two sockets, you have a 4core Xeon, not an 8core. I didn't even think scheduling 8 vCPU's on a quadcore is possible so I'm assuming you have dual QC Xeons.

    As an aside, Am I missing half the conversation because all I'm seeing is William's replies and it feels like William is cc'ing the board in his replies (seen this on mailing lists and it's frustrating, even with quoting, which isn't really happening here.)[:S]
  • Yes it is a dual cpu system.  I am only posting on the board not in the mailing list.  Maybe there is a different issue for you.

    Dan.
  • Still no difference with 4 vcpu's.  Same output from top.  I have never seen top show multiple cores like you have in your image.  I have multiple different versions and trains of linux and none of them show multiple cpu's in top like yours.  Maybe there is a button you a pressing in top to show this?

    top - 11:32:09 up 1 min,  1 user,  load average: 2.14, 0.76, 0.27
    Tasks: 160 total,   1 running, 154 sleeping,   0 stopped,   5 zombie
    Cpu(s):  1.5%us,  0.3%sy,  0.0%ni, 97.4%id,  0.7%wa,  0.0%hi,  0.1%si,  0.0%st
    Mem:   8184784k total,  2391600k used,  5793184k free,    54368k buffers
    Swap:  1048572k total,        0k used,  1048572k free,  1085748k cached

      PID USER      PR  NI  VIRT  RES  SHR S   %CPU %MEM    TIME+  COMMAND
     5236 root      20   0 31328 6788 4984 S      3  0.1   0:00.80 ctasd
     5240 root      20   0 31872 6904 5292 S      2  0.1   0:00.21 ctasd
     5237 root      20   0 20236 3896 2484 S      1  0.0   0:00.71 ctipd.bin
     4039 root      20   0 11644 9740 2484 S      1  0.1   0:00.60 selfmonng.plx
     5165 root      20   0 20004  15m 4376 S      1  0.2   0:00.69 aua_edirsync.pl
     5592 httpprox  20   0  877m 593m 8984 S      1  7.4   0:14.87 httpproxy
     3291 root      20   0  5600 1756 1536 S      0  0.0   0:00.02 hald-addon-stor
     3320 root      20   0  3952 1344  872 S      0  0.0   0:00.06 irqd
     3947 postgres  20   0 1081m 4184 3832 S      0  0.1   0:00.02 postgres
     5380 afcd      19  -1 46812  13m 5160 S      0  0.2   0:00.27 afcd
        1 root      20   0  1912  596  520 S      0  0.0   0:00.92 init
        2 root      20   0     0    0    0 S      0  0.0   0:00.00 kthreadd
        3 root      20   0     0    0    0 S      0  0.0   0:00.00 ksoftirqd/0
        4 root      20   0     0    0    0 S      0  0.0   0:00.00 kworker/0:0
        5 root       0 -20     0    0    0 S      0  0.0   0:00.00 kworker/0:0H
        6 root      20   0     0    0    0 S      0  0.0   0:00.33 kworker/u:0
        7 root       0 -20     0    0    0 S      0  0.0   0:00.00 kworker/u:0H


    utm1:/home/login # grep -i --color "model name" /proc/cpuinfo
    model name      : Intel(R) Xeon(R) CPU           E5430  @ 2.66GHz
    model name      : Intel(R) Xeon(R) CPU           E5430  @ 2.66GHz
    model name      : Intel(R) Xeon(R) CPU           E5430  @ 2.66GHz
    model name      : Intel(R) Xeon(R) CPU           E5430  @ 2.66GHz
    utm1:/home/login #


    There is no load today, as its Sunday.  

    I don't know how I can have a bad install, its just off of the ISO like everyone else.  It's not going to install linux a different way from version to version.

    Dan.
  • Ah yes, you are pressing the number 1 after loading top.  Then it shows all of the cores:

    top - 11:38:48 up 8 min,  1 user,  load average: 0.02, 0.27, 0.21
    Tasks: 151 total,   1 running, 146 sleeping,   0 stopped,   4 zombie
    Cpu0  :  0.3%us,  0.3%sy,  0.0%ni, 99.3%id,  0.0%wa,  0.0%hi,  0.0%si,  0.0%st
    Cpu1  :  0.3%us,  0.0%sy,  0.0%ni, 99.7%id,  0.0%wa,  0.0%hi,  0.0%si,  0.0%st
    Cpu2  :  0.0%us,  0.0%sy,  0.0%ni,100.0%id,  0.0%wa,  0.0%hi,  0.0%si,  0.0%st
    Cpu3  :  0.0%us,  0.3%sy,  0.0%ni, 99.7%id,  0.0%wa,  0.0%hi,  0.0%si,  0.0%st
    Mem:   8184784k total,  2429344k used,  5755440k free,    56556k buffers
    Swap:  1048572k total,        0k used,  1048572k free,  1101852k cached

      PID USER      PR  NI  VIRT  RES  SHR S   %CPU %MEM    TIME+  COMMAND
     5237 root      20   0 20236 3972 2496 S      1  0.0   0:06.65 ctipd.bin
     3320 root      20   0  3952 1344  872 S      0  0.0   0:00.48 irqd
     6202 postgres  20   0 1084m 5736 4476 S      0  0.1   0:00.19 postgres
        1 root      20   0  1912  596  520 S      0  0.0   0:00.92 init
        2 root      20   0     0    0    0 S      0  0.0   0:00.00 kthreadd
        3 root      20   0     0    0    0 S      0  0.0   0:00.00 ksoftirqd/0
  • We have finally dumped this product.  Glad it's gone!
  • that's too bad.  UTm works very well under Vmwae AND hyper-v.  It sounds like you have a misconfiguration though.  I hope whatever you choose next doesn't let a nasty through...many of them will.