This discussion has been locked.
You can no longer post new replies to this discussion. If you have a question you can start a new discussion

[9.105]What is going on with Avira

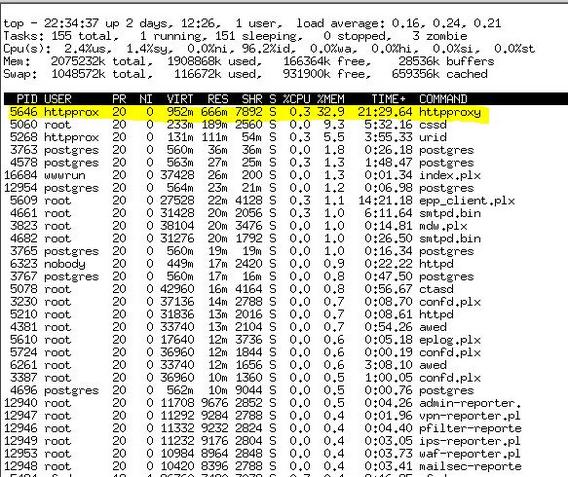
I have been running my UTM with recommended settings of single AV scan and use Avira on astaro since the endpoints use sophos. However, I had been noticing weird slowdowns. Checked some system stats last night and Avira causes some kind of memory leak in httpproxy or has a bad pattern???
Current software version...: 9.105009

Hardware type..............: Software Appliance
Installation image.........: 9.103-5.1
Installation type..........: asg
Installed pattern version..: 50364
Downloaded pattern version.: 50364

Http proxy started with avira as AV scanner:


Http Proxy Memory usage with Avira after a couple of days: 


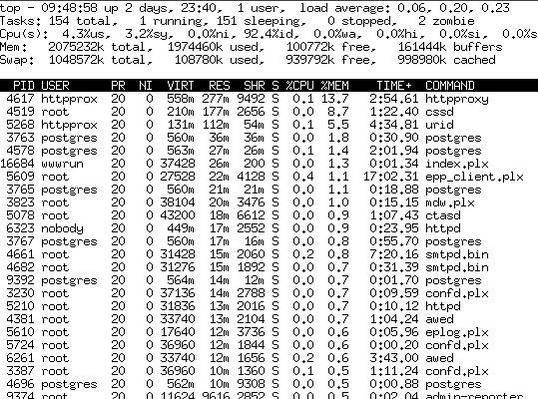
Sophos after starting proxy
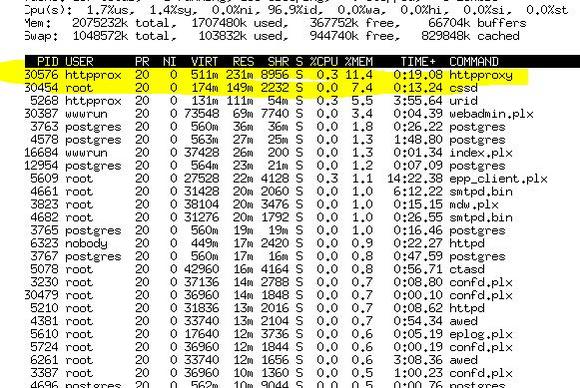
 

Sophos after 12 hrs of usage


This thread was automatically locked due to age.
Parents
  • Interesting, but I can't reproduce such a big difference on a lightly-used system with only 1GB of RAM.  The RAM usage decreases a bit, by about 50 MB instead of 400MB as in your case.  Still, I don't understand why there's much of a change at all.  What makes you suspect Avira or the way the proxy uses it?

    Cheers - Bob

    top - 12:06:07 up 11 days,  2:15,  1 user,  load average: 1.10, 0.77, 0.46
    Tasks: 163 total,   1 running, 159 sleeping,   0 stopped,   3 zombie
    Cpu(s): 52.0%us, 15.0%sy,  0.0%ni, 22.0%id, 10.7%wa,  0.0%hi,  0.3%si,  0.0%st
    Mem:   1026680k total,   978072k used,    48608k free,    21216k buffers
    Swap:  1048572k total,   412256k used,   636316k free,   296192k cached

      PID USER      PR  NI  VIRT  RES  SHR S %CPU %MEM    TIME+  COMMAND
    27476 httpprox  20   0  672m 393m 8124 S  0.3 39.2   0:23.40 httpproxy
    26682 wwwrun    20   0 54336  46m 2624 S  0.0  4.6   0:03.49 webadmin.plx
     4967 root      20   0  218m  38m  524 S  0.0  3.8  45:28.13 cssd
     3493 root      20   0 39356  20m 1456 S  0.0  2.1   8:40.73 mdw.plx
    26703 root      20   0 52696  16m 1688 S  0.0  1.6   0:00.31 confd.plx
     2905 root      20   0 50368  14m 1060 S  0.0  1.5   3:29.84 confd.plx
    27785 root      20   0 17776  14m 3668 S  5.6  1.4   0:00.80 audld.plx
    17870 root      20   0 49856  13m 1644 S  0.0  1.3   0:01.86 confd.plx
     4409 postgres  20   0  107m  11m  10m S  0.0  1.2  13:21.97 postgres


    top - 12:23:11 up 13 min,  1 user,  load average: 0.14, 1.89, 2.12
    Tasks: 158 total,   1 running, 155 sleeping,   0 stopped,   2 zombie
    Cpu(s): 14.6%us,  4.7%sy,  0.0%ni, 79.4%id,  1.0%wa,  0.0%hi,  0.3%si,  0.0%st
    Mem:   1026680k total,   986256k used,    40424k free,     5328k buffers
    Swap:  1048572k total,   318688k used,   729884k free,   284520k cached

      PID USER      PR  NI  VIRT  RES  SHR S %CPU %MEM    TIME+  COMMAND
     5401 httpprox  20   0  657m 341m 2724 S  0.0 34.1   0:44.62 httpproxy
     4958 root      20   0  218m  98m  600 S  0.0  9.9   0:22.07 cssd
     7102 wwwrun    20   0 69036  60m 2680 S  5.0  6.0   0:10.63 webadmin.plx
     7296 root      20   0 57300  28m 2556 S  5.3  2.9   0:09.04 confd.plx
     3421 postgres  20   0  104m  27m  27m S  0.0  2.7   0:00.16 postgres
     3477 root      20   0 38792  26m 2448 S  0.0  2.7   0:15.01 mdw.plx
     2891 root      20   0 50316  20m 1404 S  0.0  2.0   0:05.57 confd.plx
     7977 root      20   0 49872  17m 1648 S  0.0  1.7   0:00.25 confd.plx
     5369 root      20   0 26372  13m 3636 S  0.3  1.4   0:02.73 epp_client.plx
Reply
  • Interesting, but I can't reproduce such a big difference on a lightly-used system with only 1GB of RAM.  The RAM usage decreases a bit, by about 50 MB instead of 400MB as in your case.  Still, I don't understand why there's much of a change at all.  What makes you suspect Avira or the way the proxy uses it?

    Cheers - Bob

    top - 12:06:07 up 11 days,  2:15,  1 user,  load average: 1.10, 0.77, 0.46
    Tasks: 163 total,   1 running, 159 sleeping,   0 stopped,   3 zombie
    Cpu(s): 52.0%us, 15.0%sy,  0.0%ni, 22.0%id, 10.7%wa,  0.0%hi,  0.3%si,  0.0%st
    Mem:   1026680k total,   978072k used,    48608k free,    21216k buffers
    Swap:  1048572k total,   412256k used,   636316k free,   296192k cached

      PID USER      PR  NI  VIRT  RES  SHR S %CPU %MEM    TIME+  COMMAND
    27476 httpprox  20   0  672m 393m 8124 S  0.3 39.2   0:23.40 httpproxy
    26682 wwwrun    20   0 54336  46m 2624 S  0.0  4.6   0:03.49 webadmin.plx
     4967 root      20   0  218m  38m  524 S  0.0  3.8  45:28.13 cssd
     3493 root      20   0 39356  20m 1456 S  0.0  2.1   8:40.73 mdw.plx
    26703 root      20   0 52696  16m 1688 S  0.0  1.6   0:00.31 confd.plx
     2905 root      20   0 50368  14m 1060 S  0.0  1.5   3:29.84 confd.plx
    27785 root      20   0 17776  14m 3668 S  5.6  1.4   0:00.80 audld.plx
    17870 root      20   0 49856  13m 1644 S  0.0  1.3   0:01.86 confd.plx
     4409 postgres  20   0  107m  11m  10m S  0.0  1.2  13:21.97 postgres


    top - 12:23:11 up 13 min,  1 user,  load average: 0.14, 1.89, 2.12
    Tasks: 158 total,   1 running, 155 sleeping,   0 stopped,   2 zombie
    Cpu(s): 14.6%us,  4.7%sy,  0.0%ni, 79.4%id,  1.0%wa,  0.0%hi,  0.3%si,  0.0%st
    Mem:   1026680k total,   986256k used,    40424k free,     5328k buffers
    Swap:  1048572k total,   318688k used,   729884k free,   284520k cached

      PID USER      PR  NI  VIRT  RES  SHR S %CPU %MEM    TIME+  COMMAND
     5401 httpprox  20   0  657m 341m 2724 S  0.0 34.1   0:44.62 httpproxy
     4958 root      20   0  218m  98m  600 S  0.0  9.9   0:22.07 cssd
     7102 wwwrun    20   0 69036  60m 2680 S  5.0  6.0   0:10.63 webadmin.plx
     7296 root      20   0 57300  28m 2556 S  5.3  2.9   0:09.04 confd.plx
     3421 postgres  20   0  104m  27m  27m S  0.0  2.7   0:00.16 postgres
     3477 root      20   0 38792  26m 2448 S  0.0  2.7   0:15.01 mdw.plx
     2891 root      20   0 50316  20m 1404 S  0.0  2.0   0:05.57 confd.plx
     7977 root      20   0 49872  17m 1648 S  0.0  1.7   0:00.25 confd.plx
     5369 root      20   0 26372  13m 3636 S  0.3  1.4   0:02.73 epp_client.plx
Children
No Data