This discussion has been locked.
You can no longer post new replies to this discussion. If you have a question you can start a new discussion

9.1 High Memory Usage

We have been experiencing high memory usage since we installed 9.1 on our Sophos 425 (purchased through the hardware refresh program). After about 8 days of up time, our memory is sitting around 90% and the application daemon and snort process constantly restart. I have installed 9.103-5, but the issue is still occuring. Here is the process list at the time it was using 94%.

top - 14:46:46 up 13 days, 12:42,  3 users,  load average: 1.29, 1.37, 1.47
Tasks: 200 total,   2 running, 196 sleeping,   0 stopped,   2 zombie
Cpu(s): 26.9%us,  0.6%sy,  0.0%ni, 68.0%id,  2.3%wa,  0.0%hi,  2.2%si,  0.0%st
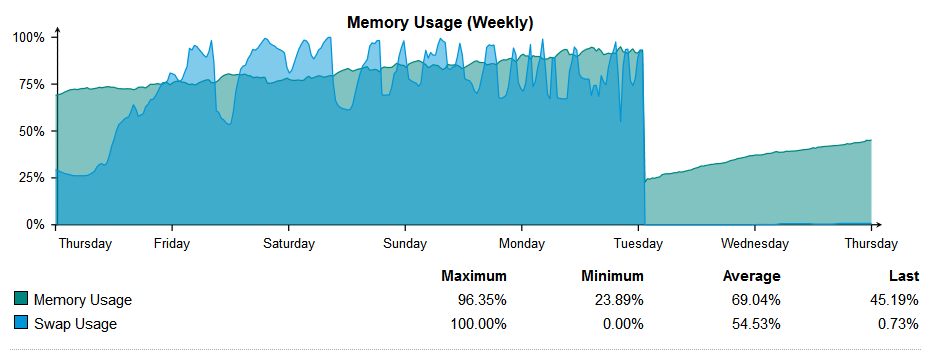
Mem:   8134044k total,  7756436k used,   377608k free,     3272k buffers
Swap:  1048572k total,   993596k used,    54976k free,   390616k cached

  PID USER      PR  NI  VIRT  RES  SHR S   %CPU %MEM    TIME+  COMMAND
 7836 snort     19  -1  407m 178m 1100 S      5  2.2   9:52.32 snort_inline
 7839 snort     19  -1  399m 109m 1116 S      4  1.4   5:47.49 snort_inline
 5567 root      20   0  251m 101m 1204 S      0  1.3   9:53.57 cssd
 7845 snort     19  -1  398m  87m 1104 S      2  1.1   6:16.45 snort_inline
17654 wwwrun    20   0 77652  67m 1300 S      0  0.8   0:08.55 webadmin.plx
28544 afcd      19  -1 72604  34m 3288 S      1  0.4   2:53.31 afcd
 3803 root      20   0 84544  33m 1772 S      0  0.4   4:24.35 mdw.plx
 5557 root      20   0 63860  29m 4836 S      0  0.4  14:21.09 ctasd
18792 root      20   0 58524  29m 2120 S      0  0.4   0:17.05 confd.plx
 7704 postgres  20   0 1081m  21m  21m S      0  0.3   0:01.33 postgres
31670 5904      20   0 65836  17m  328 S      0  0.2   0:19.98 vncfreerdp
 3209 root      20   0 50724  16m 1012 S      0  0.2   5:13.03 confd.plx
 9468 root      20   0 53360  15m 1212 S      0  0.2   0:04.73 confd.plx
 7914 postgres  20   0 1084m  15m  14m S      0  0.2   0:01.69 postgres
31591 root      20   0 50124  12m  608 S      0  0.2   0:00.05 confd.plx
 4966 root      20   0 38500  12m 1040 S      0  0.2   9:33.57 screenmgr.plx
31658 root      20   0 50124  12m  604 S      0  0.2   0:00.02 confd.plx
 7706 postgres  20   0 1081m  11m  11m S      0  0.1   0:00.33 postgres
 4779 root      20   0 33712  11m 1048 S      0  0.1  10:24.40 awed
 3747 postgres  20   0 1081m 9600 9468 S      0  0.1   0:43.78 postgres
 5186 root      20   0 33068 9264 1680 S      0  0.1  15:46.00 smtpd.bin
 5707 root      20   0 27204 9204 1708 S      0  0.1  18:57.32 epp_client.plx
 7997 root      20   0 33712 8840  876 S      0  0.1   0:04.51 awed
 7842 root      20   0 33712 8820  876 S      0  0.1   0:04.66 awed
 7843 root      20   0 33712 8500  876 S      0  0.1   0:04.20 awed
 5552 root      20   0 37384 8236 1368 S      0  0.1   2:13.20 smtpd.bin
 7943 root      20   0 33712 8108  852 S      0  0.1   0:04.13 awed
 4642 root      20   0 16096 8088 1136 S      1  0.1 611:50.53 named
 7705 postgres  20   0 1081m 6844 6744 S      0  0.1   0:00.16 postgres
27335 postgres  20   0 1084m 6844 5388 S      0  0.1   0:00.09 postgres
 1997 root      20   0 11764 6048 1708 S      0  0.1   0:01.14 admin-reporter.
 3339 root      20   0 50124 6016  600 S      0  0.1   1:35.79 confd.plx
 4549 root      20   0 12268 6016 1208 S      0  0.1   3:53.84 dns-resolver.pl
 2008 root      20   0 11832 5896 1624 S      0  0.1   0:23.25 vpn-reporter.pl
 8768 postgres  20   0 1084m 5024 4440 S      0  0.1   0:00.32 postgres
 2007 root      20   0 11332 4828 1592 S      0  0.1   0:04.51 pfilter-reporte
 2009 root      20   0 10540 4508 1592 S      0  0.1   0:02.71 mailsec-reporte
 3301 root      20   0 15576 4424 1528 S      0  0.1   0:14.00 aua.bin
 3878 root      20   0 11976 4272 1052 S      1  0.1  84:10.98 selfmonng.plx
 2013 root      20   0 10988 4012 1520 S      0  0.0   0:00.55 waf-reporter.pl
 5140 root      20   0 16020 3948 1056 S      0  0.0  21:44.43 red_server.plc
 7984 root      20   0 16828 3932 1264 S      0  0.0   0:06.55 red_server.plc
 2010 root      20   0 11228 3916 1520 S      0  0.0   0:00.59 ips-reporter.pl


Is there anything other info I should be looking at to resolve this issue? Does anyone have any idea what could be causing this?


This thread was automatically locked due to age.
  • You probably need a support ticket. Not sure what this process is[:O]
    31670 5904 20 0 65836 17m 328 S 0 0.2 0:19.98 vncfreerdp
    
  • All-


    I think VNC is a remote control tool.

    Virtual Network Computing:

    Remote access & control software for desktop & mobile platforms - RealVNC

    Regards,
    Jim
  • I'll take a guess that VNC is on the UTM for the clientless VPN / RDP access.

    I agree that you need to get Sophos support (and/or your reseller) involved.

    Anyways, PostGres seems to be using a lot of memory.
    Rebuilding the reporting databases _might_ help; but have support look at it first.

    Barry
  • @completemedical Shut off IPS (intursion protection) till support takes a look at it if the appliance is not functioning. It should free up some cpu/ram

    @ Barry, Interesting take on vnc, I use ssl vpn all the time but have never tried to make clientless rdp /vnc connection. By the way, the sql database memory usage is mostly virtual and not residential.

    Also... seems like OP is not running websecurity and still managing to consume all the ram and swap and invoking OOM. He is running multiple snort instances but they look to be fairly well behaved.
  • Hi, complete, and welcome to the User BB!

    I think Barry's got it right, Bill - Complete must have an HTML5 VPN of the VNC type.

    Complete, just for grins, what happens if you temporarily disable IPS?  Also, please use the [Go Advanced] button below and attach a picture of your Memory & Swap usage for the last week.

    What seems strange to me, guys, is that top shows 94% memory usage, but the detail only adds up to 15%.  I bet the problem might go away, maybe even permanently, with a simple reboot - have you tried that, complete?

    Cheers - Bob
    PS Glad I made the same suggestion as Billybob!
  • Bill: Yeah, I didn't see the http proxy running.

    Complete: How many concurrent connections are active?

    Barry
  • Sorry for the delayed response.

    I will contact support asap! I am using the HTML 5 VPN with a maximum for 4 concurrent connections. 

    @Bill: I did have network visibility turned on from when I was attempting to create some QoS rules, but I ended up not using the rules. I have disabled network visibility now.

    @BAlfson: I will see what disabling IPS does, and I have rebooted the appliance multiple times (this has been going on for a while, I finally got fed up with it and decided to post), and after about 10 days we are in the same boat.


    @Barry: we averaged around 5,500 concurrent connections in the last week and 7,000 in the last month.
  • Interesting.  It looks like the reboot on Tuesday afternoon resolved a problem with swap.  How about a picture for the last month, the result of version from the command line and a comment on when the system was restarted during the time on the graph.

    I don't think there will be much to see until swapping starts back up.  You might try running top every day at 10 and 2 to see any trend over a week.  Based on some of the other threads, Billybob and I guessed that it might be snort that was "eating" memory.

    Cheers - Bob


    Cheers - Bob