This discussion has been locked.
You can no longer post new replies to this discussion. If you have a question you can start a new discussion

Help needed with strange traffic analysis and control

I'm running UTM 9 (latest version) on a PC as the firewall/router for my home network. My ISP is Comcast. Recently, I started using the Flow Monitor feature from the UTM Dashboard, and I've noticed some odd traffic that concerns me. I could use some advice on how to analyze this, and control it, if it is actually a problem.

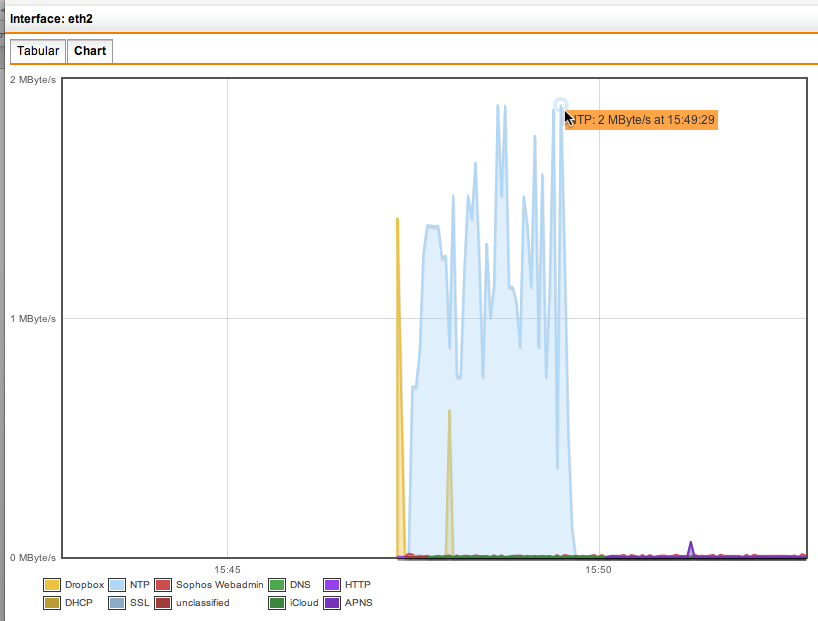
The problem appears to be bursts of NTP traffic from the Internet to my WAN address that last about 5 minutes at a time. When they occur, they pretty much dwarf all my other traffic, according to the Flow Monitor chart. I don't know if this occurs at regular intervals or not. I should note that I am not running any NTP servers, either public or private, on my LAN, and I don't even have the UTM's NTP service turned on. My LAN includes Macs, IOS devices, TiVos, a PS3, and a wireless access point (secured with WPA2), but no Windows machines.

Here's an example of what I see in the Flow Monitor chart:

Chart.png

Here's the flow monitor table that corresponds to the chart:

Table.png

If I click on the NTP line in the table, I get a list of servers that looks like this:

Server Details.png

None of those computers are known to me. If I click on the traffic number in the NTP line of the chart, I get something like this:

Total Traffic for NTP
Download   IN   81 MB
Upload   OUT   83 MB

Does this mean something inside my LAN has sent 83 MB of NTP traffic out? I can't imagine what that would be, or why. Or is that just indicating that the incoming traffic has been "bounced back" at the UTM? Every time I check the total traffic, the download and upload values are very similar.

My first concern is the Block button in the Flow Monitor table. It does create a blocking rule in the Application Control Rules, but it doesn't reduce or eliminate the NTP traffic, according to the Flow Monitor chart/table. (If it's simply showing me the traffic hitting the UTM upstream of where the blocking rule is applied, then I wouldn't expect to see any change here.)

More concerning to me is that, if not for the Flow Monitor chart/table, I would have no idea this was even going on. None of this NTP traffic appears in my UTM firewall or intrusion protection logs. Even if I turn off the application control rule block, and add a firewall rule in position #1 to block and log Internet traffic to my External (WAN) address on TCP/UDP port 123 (the NTP port), it doesn't show up in the logs. However, I can go to the ShieldsUp website (grc.com) and manually probe port 123, and that does show up in the firewall log.

So, does anyone have an idea what's causing this traffic? If it's trying to get to something on my LAN, how do I figure out what the target is? What else should I be doing to try to capture/analyze this situation? If it's a problem, is there anything else I can do to control it? Any help would be appreciated.


This thread was automatically locked due to age.
Parents
  • What's in 'Allowed networks' in 'Networking Services >> NTP'?

    What's in 'NTP servers' on the 'Time & Date' tab of 'Management >> System Settings'?

    I'll just guess that someone is attempting a DoS attack on you by sending requests to NTP servers around the world from your (spoofed) IP.  Check out [ntp:questions] NTP Denial of Service attack 29 November 2011

    Fortunately, it looks like most everyone has applied the patch long ago.  Is there anything about Anti-DoS UDP Flooding in the Intrusion Prevention log?

    Cheers - Bob
  • What's in 'Allowed networks' in 'Networking Services >> NTP'?


    "Internal (Network)" is there, however, I have the service turned off.

    What's in 'NTP servers' on the 'Time & Date' tab of 'Management >> System Settings'?


    "NTP Server Pool", which I defined in Network Definitions as a DNS group pointing to us.pool.ntp.org.

    I'll just guess that someone is attempting a DoS attack on you by sending requests to NTP servers around the world from your (spoofed) IP.  Check out [ntp:questions] NTP Denial of Service attack 29 November 2011


    I had considered that possibility, but I can't think of any reason why I would be targeted. Another possibility I considered is that some botnet thinks a command-and-control server is running at my IP, and they're trying to communicate with it. I believe there's at least one botnet that attempts to disguise its traffic as NTP traffic. But that doesn't seem likely either. I should note that my ISP is Comcast, so I don't have a static IP address, but it is what they call "persistent". I've had this one for almost a year,

    Fortunately, it looks like most everyone has applied the patch long ago.  Is there anything about Anti-DoS UDP Flooding in the Intrusion Prevention log?


    No. In fact, the Intrusion Prevention log is currently empty. But intrusion protection is turned on, as are all three flood protection options.

  • I should note that my ISP is Comcast, so I don't have a static IP address, but 


    I'd run the tcpdumps first, and if the traffic is from random sources and is not entering the internal network, I'd recommend getting a new IP.
    You could call Comcast, or you could leave the modem off for 24 hours or so.

    Barry
  • I'd run the tcpdumps first, and if the traffic is from random sources and is not entering the internal network, I'd recommend getting a new IP.


    Well, that was interesting, although I'm not sure if I'm interpreting the results correctly. I ran tcpdump on my internal interface first:

    > sudo /usr/sbin/tcpdump -i eth0 -nn port 123

    And it was dead quiet. Not a thing going in or out. Just to make sure it was working, I opened the Date & Time system preference panel on one of my Macs (IP 192.168.1.100), which causes it to ask a time server for the time. And I saw that. It tried various servers, and got no responses, because my firewall rule was blocking them. Then I turned off the firewall rule briefly, and saw the time servers responding:

    01:45:50.428864 IP 192.168.1.100.52629 > 17.171.4.15.123: NTPv4, Client, length 48
    01:46:05.429343 IP 192.168.1.100.53375 > 17.151.16.20.123: NTPv4, Client, length 48
    01:46:20.428979 IP 192.168.1.100.61851 > 17.171.4.34.123: NTPv4, Client, length 48
    01:46:35.429456 IP 192.168.1.100.60896 > 17.171.4.13.123: NTPv4, Client, length 48
    01:46:50.429896 IP 192.168.1.100.56589 > 17.171.4.36.123: NTPv4, Client, length 48
    01:47:05.430339 IP 192.168.1.100.57448 > 17.151.16.12.123: NTPv4, Client, length 48
    01:47:20.430778 IP 192.168.1.100.62098 > 17.171.4.33.123: NTPv4, Client, length 48
    01:47:35.430741 IP 192.168.1.100.53591 > 17.151.16.14.123: NTPv4, Client, length 48

    01:47:50.431195 IP 192.168.1.100.50795 > 17.151.16.22.123: NTPv4, Client, length 48
    01:47:50.518498 IP 17.151.16.22.123 > 192.168.1.100.50795: NTPv4, Server, length 48
    01:47:51.524084 IP 192.168.1.100.123 > 17.171.4.15.123: NTPv4, Client, length 48
    01:47:51.562889 IP 17.171.4.15.123 > 192.168.1.100.123: NTPv4, Server, length 48
    01:47:52.523731 IP 192.168.1.100.123 > 17.171.4.15.123: NTPv4, Client, length 48
    01:47:52.567517 IP 17.171.4.15.123 > 192.168.1.100.123: NTPv4, Server, length 48

    So, I assume that's what it *ought* to look like. And it appears that NTP requests going out get a "Client" tag, and responses from the NTP servers get a "Server" tag.

    Next, I turned the firewall rule back on and tried a tcpdump on the external interface:

    > sudo /usr/sbin/tcpdump -i eth2 -nn port 123

    Within a few seconds, I had screenfulls of output. (My public IP is 50.147.56.108.) Here's a small sampling:

    01:52:39.488392 IP 50.147.56.108.123 > 50.28.8.223.123: NTPv4, Client, length 48
    01:52:39.488443 IP 50.147.56.108.123 > 67.207.128.163.123: NTPv4, Client, length 48
    01:52:39.488468 IP 50.147.56.108.123 > 50.112.150.45.123: NTPv4, Client, length 48
    01:52:39.488487 IP 50.147.56.108.123 > 64.233.245.204.123: NTPv4, Client, length 48
    01:52:39.488505 IP 50.147.56.108.123 > 173.8.103.243.123: NTPv4, Client, length 48
    01:52:39.488536 IP 50.147.56.108.123 > 216.119.146.38.123: NTPv4, Client, length 48
    01:52:39.490828 IP 50.147.56.108.123 > 69.64.58.101.123: NTPv4, Client, length 48
    01:52:39.490861 IP 50.147.56.108.123 > 216.37.64.3.123: NTPv4, Client, length 48
    01:52:39.518532 IP 216.119.146.38.123 > 50.147.56.108.123: NTPv4, Server, length 48
    01:52:39.530637 IP 216.37.64.3.123 > 50.147.56.108.123: NTPv4, Server, length 48
    01:52:39.532383 IP 50.28.8.223.123 > 50.147.56.108.123: NTPv4, Server, length 48
    01:52:39.541519 IP 64.233.245.204.123 > 50.147.56.108.123: NTPv4, Server, length 48
    01:52:39.556047 IP 173.8.103.243.123 > 50.147.56.108.123: NTPv4, Server, length 48
    01:52:39.565881 IP 67.207.128.163.123 > 50.147.56.108.123: NTPv4, Server, length 48
    01:52:39.577977 IP 50.112.150.45.123 > 50.147.56.108.123: NTPv4, Server, length 48

    This really has me confused. If I'm correctly interpreting this, based on what I saw on the internal interface, it looks to me like my UTM is initiating the NTP commands going out, and the servers are responding a short time later. In almost every case, when an IP address appears on a line labeled "Client", it shows up again a few lines later on a line labeled "Server". Can that possibly be right, or do I have that exactly backwards? Also, note that this all occurred with an ANY ANY NTP DROP rule, with logging enabled, in the #1 position.

    One more thing, which may have a bearing on all this. I mentioned in a previous reply that in System Settings:Time and Date, I had my NTP servers set to "NTP Server Pool", which I defined in Definitions & Users:Network Definitions as "us.pool.ntp.org". When I looked at my definition for "NTP Server Pool" just now, next to the blue (i) icon, it tells me "us.pool.ntp.org [128.255.70.89 (448 IPs total)]. So, I'm wondering -- I don't know how often the UTM wants to contact a NTP server to check the time, but is it possible that when it does, it's sending out requests to every one of those 448 NTP servers? Can anyone else confirm all this on their own UTM? I'm currently running firmware version 9.101.12.

    -- Bruce
  • One more thing, which may have a bearing on all this. I mentioned in a previous reply that in System Settings:Time and Date, I had my NTP servers set to "NTP Server Pool", which I defined in Definitions & Users:Network Definitions as "us.pool.ntp.org". When I looked at my definition for "NTP Server Pool" just now, next to the blue (i) icon, it tells me "us.pool.ntp.org [128.255.70.89 (448 IPs total)]. So, I'm wondering -- I don't know how often the UTM wants to contact a NTP server to check the time, but is it possible that when it does, it's sending out requests to every one of those 448 NTP servers? Can anyone else confirm all this on their own UTM? I'm currently running firmware version 9.101.12.


    Replying to myself -- Since I seem to be inflicted with insomnia tonight, I decided to run some more tests.

    First, I removed my DNS group that pointed to us.pool.ntp.org from my NTP server list, and added two individual NTP hosts. I also temporarily disconnected most of the other devices on my local network, just to eliminate any TCP traffic from them. I ran tcpdump on the external interface again and just watched for a while. What I found was that every 2 minutes and 10 seconds (approximately), the UTM polled each of the two NTP servers once.

    Then I created a DNS group called "Apple Time Servers" and pointed it to time.apple.com, which is the default used by Macs. The UTM reported that it resolved to 15 IP addresses. I then removed the two individual NTP servers from my NTP server list, and added the Apple Time Servers DNS group. Again, I watched the tcpdump results, and found that every 2 minutes and 10 seconds (approximately), the UTM polled each of the 15 NTP servers once. But other than that, the interface was quiet.

    That seems like a bug to me. Given that the NTP server list could contain an arbitrarily large list of servers, the UTM shouldn't need to poll every one of those servers every two minutes and ten seconds.

    Finally, I deleted the Apple Time Servers group from the NTP Server list and added my NTP Server Pool group again, which the UTM still claimed was resolving to 448 IP addresses (more on that in a moment). The tcpdump results showed that the interface was immediately flooded with NTP traffic. I let it run for a while, and the traffic never stopped. I'm postulating that the 2:10 interval between polling periods isn't long enough to let it poll all 448 servers once, so after 2:10, while it's still polling some of the servers for the first time, it's also starting a second round of polling. And that second round isn't finished by the time the next 2:10 interval comes around, so yet another round of polling gets added to the existing traffic. The end result is that the UTM is constantly polling hundreds of time servers.

    One more thing -- it didn't make sense to me that us.pool.ntp.org ought to resolve to 448 IPs. I'm sure I've never seen it resolve to more than 3 or 4 IPs in the past. So, I went into Network Definitions and completely deleted that DNS group, then added it back. Now it tells me it resolves to only 3 IP addresses. I my NTP server list to only that group, and now it seems to be working reasonably well. Every 2:10, it polls each of the three servers in the list once, and then all is quiet until the next interval.

    So, I don't know how us.pool.ntp.org ended up resolving to 448 IPs. It might have been some kind of screwup at ntp.org's DNS server, but I'm wondering if it's possible that this is another UTM bug. Perhaps when it periodically re-resolves the DNS Group address, if it sees a new IP address, it adds it to the group list, but it never removes any old addresses. If so, then I would expect the group list to grow over time. I'll try to keep an eye on it for a few days and see if something like that appears to be happening.

    Anyway, for now, my problem seems to be resolved. Flow Monitor is no longer reporting enormous amounts of NTP traffic on my external interface. And I guess the reason I never saw the traffic in my firewall logs is that the logs don't record traffic generated by the UTM itself.

    -- Bruce
Reply
  • One more thing, which may have a bearing on all this. I mentioned in a previous reply that in System Settings:Time and Date, I had my NTP servers set to "NTP Server Pool", which I defined in Definitions & Users:Network Definitions as "us.pool.ntp.org". When I looked at my definition for "NTP Server Pool" just now, next to the blue (i) icon, it tells me "us.pool.ntp.org [128.255.70.89 (448 IPs total)]. So, I'm wondering -- I don't know how often the UTM wants to contact a NTP server to check the time, but is it possible that when it does, it's sending out requests to every one of those 448 NTP servers? Can anyone else confirm all this on their own UTM? I'm currently running firmware version 9.101.12.


    Replying to myself -- Since I seem to be inflicted with insomnia tonight, I decided to run some more tests.

    First, I removed my DNS group that pointed to us.pool.ntp.org from my NTP server list, and added two individual NTP hosts. I also temporarily disconnected most of the other devices on my local network, just to eliminate any TCP traffic from them. I ran tcpdump on the external interface again and just watched for a while. What I found was that every 2 minutes and 10 seconds (approximately), the UTM polled each of the two NTP servers once.

    Then I created a DNS group called "Apple Time Servers" and pointed it to time.apple.com, which is the default used by Macs. The UTM reported that it resolved to 15 IP addresses. I then removed the two individual NTP servers from my NTP server list, and added the Apple Time Servers DNS group. Again, I watched the tcpdump results, and found that every 2 minutes and 10 seconds (approximately), the UTM polled each of the 15 NTP servers once. But other than that, the interface was quiet.

    That seems like a bug to me. Given that the NTP server list could contain an arbitrarily large list of servers, the UTM shouldn't need to poll every one of those servers every two minutes and ten seconds.

    Finally, I deleted the Apple Time Servers group from the NTP Server list and added my NTP Server Pool group again, which the UTM still claimed was resolving to 448 IP addresses (more on that in a moment). The tcpdump results showed that the interface was immediately flooded with NTP traffic. I let it run for a while, and the traffic never stopped. I'm postulating that the 2:10 interval between polling periods isn't long enough to let it poll all 448 servers once, so after 2:10, while it's still polling some of the servers for the first time, it's also starting a second round of polling. And that second round isn't finished by the time the next 2:10 interval comes around, so yet another round of polling gets added to the existing traffic. The end result is that the UTM is constantly polling hundreds of time servers.

    One more thing -- it didn't make sense to me that us.pool.ntp.org ought to resolve to 448 IPs. I'm sure I've never seen it resolve to more than 3 or 4 IPs in the past. So, I went into Network Definitions and completely deleted that DNS group, then added it back. Now it tells me it resolves to only 3 IP addresses. I my NTP server list to only that group, and now it seems to be working reasonably well. Every 2:10, it polls each of the three servers in the list once, and then all is quiet until the next interval.

    So, I don't know how us.pool.ntp.org ended up resolving to 448 IPs. It might have been some kind of screwup at ntp.org's DNS server, but I'm wondering if it's possible that this is another UTM bug. Perhaps when it periodically re-resolves the DNS Group address, if it sees a new IP address, it adds it to the group list, but it never removes any old addresses. If so, then I would expect the group list to grow over time. I'll try to keep an eye on it for a few days and see if something like that appears to be happening.

    Anyway, for now, my problem seems to be resolved. Flow Monitor is no longer reporting enormous amounts of NTP traffic on my external interface. And I guess the reason I never saw the traffic in my firewall logs is that the logs don't record traffic generated by the UTM itself.

    -- Bruce
Children

  • So, I don't know how us.pool.ntp.org ended up resolving to 448 IPs. It might have been some kind of screwup at ntp.org's DNS server, but I'm wondering if it's possible that this is another UTM bug. 


    That does seem like a bug.
    If it happens again, take a look at 
    /var/chroot-ntp/etc/ntp.conf.external

    Mine has 3 entries in it (3 IPs from us.pool.ntp.org, presumably).

    istm that the UTM should just put the hostname(s), e.g. us.pool.ntp.org, into this file, so that ntpd can do the DNS resolution and caching, but maybe I'm missing something.

    'nslookup' on my firewall gets 4 IPs for the pool, fwiw:

    > nslookup us.pool.ntp.org
    Server:         127.0.0.1
    Address:        127.0.0.1#53

    Non-authoritative answer:
    Name:   us.pool.ntp.org
    Address: 134.121.64.62
    Name:   us.pool.ntp.org
    Address: 149.20.68.17
    Name:   us.pool.ntp.org
    Address: 192.249.57.45
    Name:   us.pool.ntp.org
    Address: 204.109.63.243

    Barry