This discussion has been locked.
You can no longer post new replies to this discussion. If you have a question you can start a new discussion

BUG: 8.201 using 100% of CPU

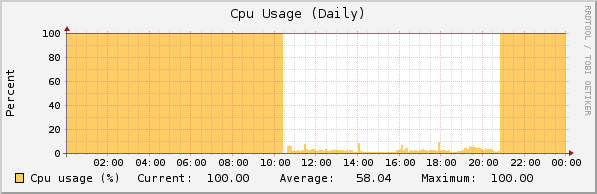
I have been using 8.103 for some time and had no issues with CPU usage. However after the update to 8.201, ASG Home has been consuming 100% of the CPU.  I rebooted the machine both days and CPU usage returns to normal, but eventually will jump back up again.  See the attached graph.

cpuusage_daily.png

In addition to this issue, I noticed that I am unable to double scan web downloads or the download is never accessible. With double scanning enabled, I see the Astaro download screen, but then it jumps to a blank page. In 8.103 this worked fine, but in 8.201 unless I just select single scan, I am unable to get downloaded files. A specific example was this link.

http://www.linuxjournaldigital.com/01d49f0edcd9418d3c3a3b20034855a6/4e55247b/linuxjournal/201109/data/linuxjournal201109-dl.pdf?lm=1314190536000

Any assistance on these issues would be appreciated.

Mike


This thread was automatically locked due to age.
  • Same Issue here with the cpu at 100%

    The httpproxy and the webadmin use the 100% of cpu, I turn off and on the webproxy and the cpu steel's on 100%,
    part 1:

    USER       PID %CPU %MEM    VSZ   RSS TTY      STAT START   TIME COMMAND
    
    root         2  0.0  0.0      0     0 ?        S    Aug21   0:00 [kthreadd]
    root         3  0.0  0.0      0     0 ?        S    Aug21   0:00  \_ [ksoftirqd/0]
    root         4  0.0  0.0      0     0 ?        S    Aug21   1:34  \_ [events/0]
    root         5  0.0  0.0      0     0 ?        S    Aug21   0:00  \_ [khelper]
    root        10  0.0  0.0      0     0 ?        S    Aug21   0:00  \_ [async/mgr]
    root        11  0.0  0.0      0     0 ?        S    Aug21   0:00  \_ [pm]
    root        76  0.0  0.0      0     0 ?        S    Aug21   0:00  \_ [sync_supers]
    root        78  0.0  0.0      0     0 ?        S    Aug21   0:00  \_ [bdi-default]
    root        80  0.0  0.0      0     0 ?        S    Aug21   0:00  \_ [kblockd/0]
    root        82  0.0  0.0      0     0 ?        S    Aug21   0:00  \_ [kacpid]
    root        83  0.0  0.0      0     0 ?        S    Aug21   0:00  \_ [kacpi_notify]
    root        84  0.0  0.0      0     0 ?        S    Aug21   0:00  \_ [kacpi_hotplug]
    root       162  0.0  0.0      0     0 ?        S    Aug21   0:00  \_ [ksuspend_usbd]
    root       166  0.0  0.0      0     0 ?        S    Aug21   0:00  \_ [khubd]
    root       169  0.0  0.0      0     0 ?        S    Aug21   0:00  \_ [kseriod]
    root       199  0.0  0.0      0     0 ?        S    Aug21   0:00  \_ [kondemand/0]
    root       214  0.0  0.0      0     0 ?        S    Aug21   0:01  \_ [kswapd0]
    root       215  0.0  0.0      0     0 ?        S    Aug21   0:00  \_ [aio/0]
    root       216  0.0  0.0      0     0 ?        S    Aug21   0:00  \_ [crypto/0]
    root       865  0.0  0.0      0     0 ?        S    Aug21   0:00  \_ [redd/0]
    root       883  0.0  0.0      0     0 ?        S    Aug21   0:00  \_ [edac-poller]
    root       945  0.0  0.0      0     0 ?        S    Aug21   0:00  \_ [ata/0]
    root       946  0.0  0.0      0     0 ?        S    Aug21   0:00  \_ [ata_aux]
    root       952  0.0  0.0      0     0 ?        S    Aug21   0:00  \_ [scsi_eh_0]
    root       955  0.0  0.0      0     0 ?        S    Aug21   0:00  \_ [scsi_eh_1]
    root      2767  0.0  0.0      0     0 ?        S    Aug21   0:12  \_ [flush-8:0]
    root      2768  0.0  0.0      0     0 ?        S    Aug21   0:10  \_ [kjournald]
    root      3931  0.0  0.0      0     0 ?        S    Aug21   0:00  \_ [kjournald]
    root      3932  0.0  0.0      0     0 ?        S    Aug21   0:17  \_ [kjournald]
    root      3933  0.0  0.0      0     0 ?        S    Aug21   0:16  \_ [kjournald]
    root      3934  0.0  0.0      0     0 ?        S    Aug21   0:01  \_ [kjournald]
    root      3990  0.0  0.0      0     0 ?        S    Aug21   0:00  \_ [kauditd]
    root         1  0.0  0.0   1816   592 ?        Ss   Aug21   0:03 init [3]  
    root      2833  0.0  0.0   2244   440 ?        S
    at        4793  0.0  0.0   2236   496 ?        Ss   Aug21   0:00 /usr/sbin/atd
    root      4899  0.0  0.0   2116   468 ?        Ss   Aug21   0:00 /usr/local/bin/asg_ha_zeroconf
    root      4906  0.0  0.5  14052 10416 ?        S    Aug21   0:00 /usr/local/bin/notifier.plx -d
    postgres  4930  0.0  0.2  46764  5264 ?        S    Aug21   0:15 /usr/bin/postgres -D /var/storage/pgsql/data
    postgres  4947  0.0  1.6  46764 34760 ?        Ss   Aug21   1:22  \_ postgres: writer process                    
    postgres  4948  0.0  0.0  46764  1052 ?        Ss   Aug21   1:36  \_ postgres: wal writer process                
    postgres  4949  0.0  0.0  47004  1344 ?        Ss   Aug21   0:18  \_ postgres: autovacuum launcher process       
    postgres  4950  0.0  0.0   7212   992 ?        Ss   Aug21   0:39  \_ postgres: stats collector process           
    postgres  5711  0.4  1.8  49576 38396 ?        Ss   Aug21  31:09  \_ postgres: reporting reporting [local] idle  
    postgres  6332  0.0  0.3  49240  7296 ?        Ss   Aug21   0:00  \_ postgres: postgres smtp 127.0.0.1(36886) idle
    postgres  9273  0.1  0.2  49240  5228 ?        Ss   10:51   0:07  \_ postgres: postgres smtp 127.0.0.1(56995) idle


    cpu type and speed?  are you running inside a vm?  how much ram..system stats please.
  • I set things to manual, enabled dual scan and performed an update. There did not seem to be anything interesting in the log.


    Starting Up2Date Package Downloader
    2011:08:28-20:07:01 router audld[11466]: patch up2date possible
    2011:08:28-20:07:13 router audld[11466]: id="3701" severity="info" sys="system" sub="up2date" name="Authentication successful"
    2011:08:28-20:08:21 router audld[11566]: Starting Up2Date Package Downloader
    2011:08:28-20:08:21 router audld[11566]: patch up2date possible
    2011:08:28-20:08:23 router audld[11566]: id="3701" severity="info" sys="system" sub="up2date" name="Authentication successful"
    2011:08:28-20:09:49 router audld[11766]: Starting Up2Date Package Downloader
    2011:08:28-20:09:49 router audld[11766]: patch up2date possible
    2011:08:28-20:09:51 router audld[11766]: id="3701" severity="info" sys="system" sub="up2date" name="Authentication successful"


    Mike
  • The firewall is running on an ESXi server (4.1) Core2Duo 2Gz, with 2GB of RAM.  In the past, the most CPU used by the machine was 2-5% (looking at past logs) but now it jumps to 100% regularly.

    Mike
  • ok, we'll check the patterns a different way.  You'll need to use WinSCP.  See the attached screenshot.  These are the patterns in a current ClamAV store.  Note the time/date stamps and sizes.  How do yours compare?

    Then in /var/up2date you'll see two directories for ClamAV, clam and clam-install.  Both of these should have a recent time/date stamp and be empty.
  • part of your issue is astaro requires 2 gigs by itself.  put 4 gigs into your esxi host and see if things don't improve.
  • part of your issue is astaro requires 2 gigs by itself.  put 4 gigs into your esxi host and see if things don't improve.


    Sorry, I meant that Astaro has 2GB, the machine has 8GB.  Not a memory problem.

    Mike
  • ok, we'll check the patterns a different way.  You'll need to use WinSCP.  See the attached screenshot.  These are the patterns in a current ClamAV store.  Note the time/date stamps and sizes.  How do yours compare?

    Then in /var/up2date you'll see two directories for ClamAV, clam and clam-install.  Both of these should have a recent time/date stamp and be empty.


    OK, I enabled shell access and took a look at those directories. They seem to look OK, assuming that 8/08/11 for the two files below is correct. The sizes are as expected.


    -rw-r--r-- 1 root root   478208 2011-08-08 17:35 bytecode.cld
    -rw-r--r-- 1 root root 11320832 2011-08-28 17:35 daily.cld
    -rw-r--r-- 1 root root 26224310 2011-08-08 17:35 main.cvd
    -rw-r--r-- 1 root root        0 2011-08-28 19:23 reload


    drwxr-xr-x 2 root root 4096 2011-08-28 19:23 clam
    drwxr-xr-x 2 root root 4096 2011-08-28 19:23 clam-install


    Mike
  • They seem to look OK, assuming that 8/08/11 for the two files below is correct. The sizes are as expected.
    Yep, your definitions are ok.
  • It's not the patterns then.  Have you been able to find anything in the logs correlating with the CPU spikes yet?
  • I have the same issue, since update to 8.201.

    The CPU runs @ 100% by normal Surfing the Web. During this time you can't reach any site. It ends in a timeout...

    I'm running Astaro on ESXi 4.1.
    Also since update the Astaro use lots of swap memory (about 60%), altrough i give it 300mb more there was no change...