This discussion has been locked.
You can no longer post new replies to this discussion. If you have a question you can start a new discussion

[7.401] Spiking CPU

Some time after updating to 7.401, our firewall is showing spiking CPU utilization on periodic intervals which starts around 6am and stops at midnight.

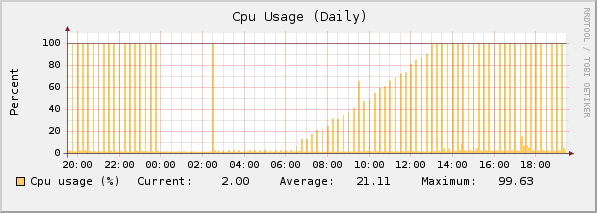
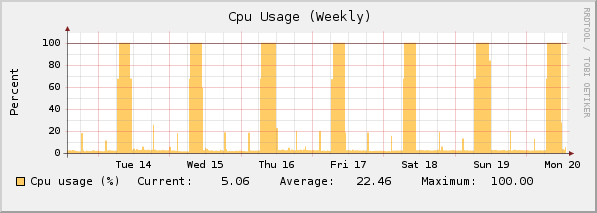
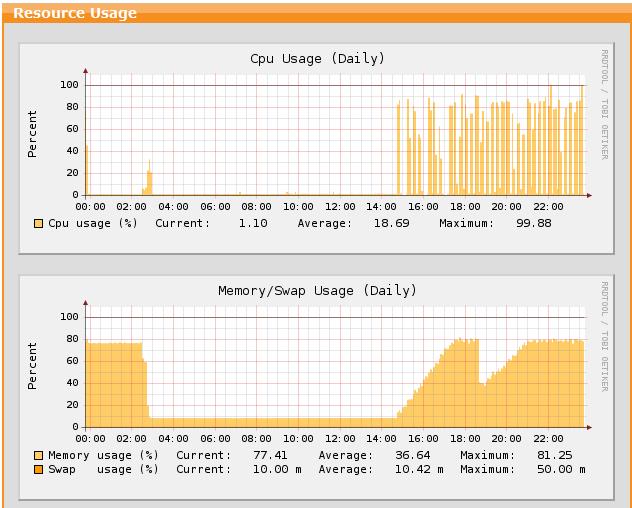
I managed to log in to the console and catch the culprit in the act, it's a postgres process for the reporting user using 100% CPU.

Known issue?  Should I open a support ticket?

> ps aux|grep postgres

postgres  3241  0.0  0.5  48816  5356 ?        S    Mar20   0:50 /usr/bin/postgres -D /var/storage/pgsql/data
postgres  3247  0.0  3.3  48944 34956 ?        Ss   Mar20   0:02 postgres: writer process                    
postgres  3248  0.0  0.1  48816  1092 ?        Ss   Mar20   0:01 postgres: wal writer process                
postgres  3249  0.0  0.1  49112  1352 ?        Ss   Mar20   0:00 postgres: autovacuum launcher process       
postgres  3250  0.0  0.1   6968  1076 ?        Ss   Mar20   0:40 postgres: stats collector process           
postgres  4052  0.0  3.5  49640 37036 ?        Ss   Mar20  21:02 postgres: reporting reporting [local] idle  
postgres  4331  0.0  1.0  50000 10964 ?        Ss   Mar20   0:00 postgres: postgres smtp 127.0.0.1(38284) idle
postgres 17723  0.0  0.4  50028  4732 ?        Ss   17:20   0:01 postgres: postgres smtp 127.0.0.1(53737) idle
postgres 21328 91.6  6.5  88728 67624 ?        Rs   17:47   2:10 postgres: reporting reporting [local] SELECT


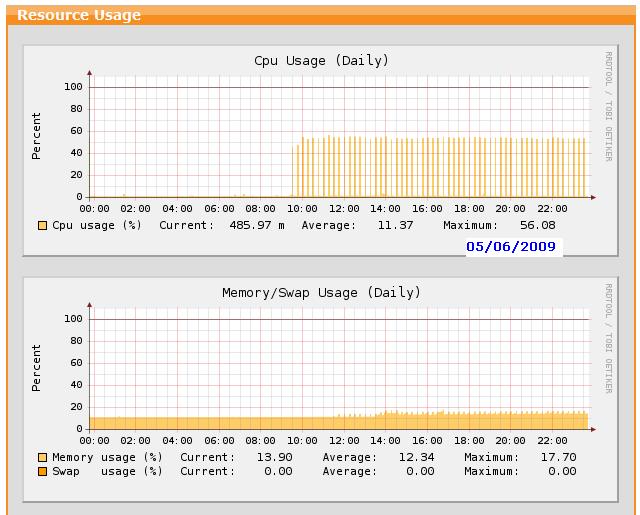
Edit: This affects 7.402 as well.


This thread was automatically locked due to age.
Parents
  • It's probably the accounting system. It's not a problem unless it's slowing down the system noticably for other features.

    Can you post your CPU graphs (reporting-hardware), and your hardare specs (CPU model/speed and RAM amount)?

    Barry
  • Whoops, I meant to attach the CPU usage charts, but forgot.  Here they are now for daily, weekly and monthly.

    Hardware is fairly beefy for the amount of traffic it pushes, though the hardware is probably about 4 years old.
    2.8GHz Xeon
    1GB RAM
    HW SCSI RAID1 (10k disks)
  • They look just like mine on my home system (lots of p2p traffic).

    Not a huge problem, but as it could be slowing things down you might want to mention it to support.

    Barry
  • Here's the help for this issue I received from Astaro.  This is excerpted from multiple e-mails and edited.

    There has been a problem with the data that is going into the maintenance run.  The problem is most evident on less powerful ASG's - where it's obvious in the CPU graphs.  It can be hard to see on more powerful boxes.  You can run these commands at any time.  Basically this cleans up the Postgres db.  Note that running this cleanup as listed will reset some reporting stats.

    Login to your Astaro using SSH.

    Run "top" and you should see that postgres is taking up over 90% of the CPU (when it's happening).

    Run "/etc/init.d/postgresql restart" to restart postgres and see if CPU usage goes back to normal operating conditions.

    Remake, reindex and vacuum the postgres database.
    The commands to run are:
    /etc/init.d/ulog stop
    /var/storage/pgsql/init/reporting_db_init.sh
    /etc/init.d/ulog start
    /var/mdw/scripts/smtp restart
    psql -Ureporting -c"reindex database reporting;" reporting
    psql -Ureporting -c"vacuum;" reporting

    (You can cut and paste the lines as needed to make it a bit faster)

    You will see output to the effect of "...can't be created, already exists" and
    "only the owner can vacuum..." disregard these messages, as long as the task completes, then it is all set.
  •   Note that running this cleanup as listed may reset some reporting stats.
    [..]
    /var/storage/pgsql/init/reporting_db_init.sh


    This command will drop the reporting databases, and re-create them. Therefore, this will reset all of the accounting data, the data used for the dynamic web security/mail security/network usage reporting, and the inline reporting data (the tables shown in menu points like "Definitions", "Network", "Network Security", etc, which are also used in the executive reports). The inline reports only show daily data anyway, so they will recover pretty fast, but the other reports will be affected for a longer time. 
    The shown commands will do the trick, but I wanted to point out that this "performance improvement" comes at a price.

    Cheers,
     andreas
  • I have the same Problem since Updating to 7.4.
    I did the commands written by eganders,
    hope they help...

    cu SveN
  • psql -Ureporting -c"reindex database reporting;" reporting
    psql -Ureporting -c"vacuum;" reporting

    Hmm, reindex on PostgreSQL is generally only needed if the indexes have gotten bloated.

    Vacuum should be run automatically if PostgreSQL is configured properly.

    Sounds like an analyze should be run as well (which should also happen automatically if configured properly).

    Looking at the configuration file, it seems that a number of configuration items could be optimized a lot better for the hardware.

    Would have to look at the query that is pegging PostgreSQL to see if perhaps there is a missing index or something that's causing things to be run inefficiently.
  • I have the same Problem since Updating to 7.4.
    I did the commands written by eganders,
    hope they help...

    cu SveN


    They helped :-)
Reply Children
  • Running 7.401 on Core2Duo 3gigs of RAM.

    Getting 50% + CPU usage.  Strange thing is it happens same times every day.
    (see attached JPG)

    Here is the usage line with "53.1" being CPU:
    postgres 17082 53.1  2.5 125640 80164 ?        Ds   17:32   0:56  \_ postgres: reporting reporting [local] SELECT

    I ran the above SSH database commands and at first it helped but then the usage was back up above 50%.  [:S]

    Is this addressed at all in 7.402?

    Thanks
  • There are other threads that discuss turning turning off Hyperthreading.  It sounds like that might help you.
  • No Hyperthreading turned on here...
  • Running 7.401 on Core2Duo 3gigs of RAM.

    Getting 50% + CPU usage.  Strange thing is it happens same times every day.
    (see attached JPG)

    Here is the usage line with "53.1" being CPU:
    postgres 17082 53.1  2.5 125640 80164 ?        Ds   17:32   0:56  \_ postgres: reporting reporting [local] SELECT

    I ran the above SSH database commands and at first it helped but then the usage was back up above 50%.  [:S]

    Is this addressed at all in 7.402?

    Thanks


    Could this just be your database update?  When did you upgrade to 7.4xx?
  • Updated a few weeks ago so that is not an issue.

    Take a look at the attached JPG ... see how we start getting CPU spikes around 3 pm.  And also how the memory starts filling up?   It does this every day.   [:S]
  • I'd submit a support request to Astaro.

    Cheers - Bob
  • If you ran all the Postgres rebuild commands, I'm with Bob.  Open a support ticket.  You've got something else going on. The consistent 3:00 start time looks like a database issue of some sort.
  • This still affects 7.402 as well on my system.  I've explicitly run the reindex and a vacuum full analyze on the reporting database now.  We'll see how that works...
  • As previously posted above, I was running ASG software that was a 7.3 install and was upgraded to 7.401.

    An Astaro tech thought it might be a problem related to the 7.3 update to 7.4.

    So I took another box and installed a clean version of 7.402 from ISO, imported my config and am running it now.

    I am now only getting about 40% CPU spikes and no memory hog problems ... see screen shot.

    The CPU usage is still postgres:

    USER       PID %CPU %MEM    VSZ   RSS TTY      STAT START   TIME COMMAND
    postgres 15409 44.3  3.1 125668 98212 ?        Rs   18:47   2:26  \_ postgres: reporting reporting [local] SELECT

    I am still interested in knowing what these CPU spikes are.
    I have a ticket open with Astaro support and will follow up with them.

    Thanks
  • For now if you're not worried about the reporting, just go and disable the accounting reporting.  That "fixed" the CPU spikes for me.

    Go to Reporting->Settings and uncheck Accounting.  Wait 12-24 hours and the spikes should stop.