

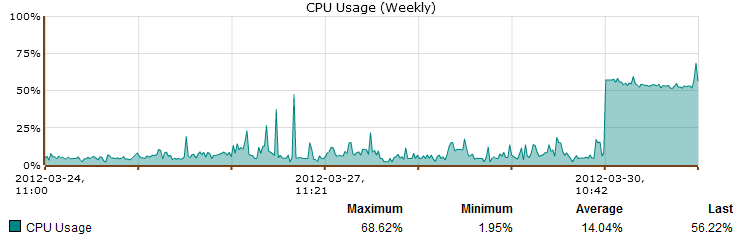
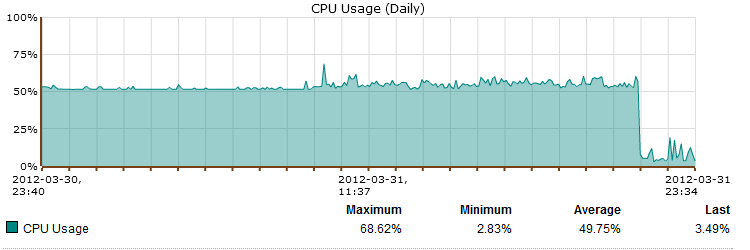
The CPU went up suddenly because of httpd and since then it stayed there (55%). Before the increase the cpu was around 15%
attached is the diagram as well
wwwrun 31676 99.2 0.1 18656 4724 ? R Mar30 1452:42 \_ /bin/httpd -f /etc/httpd/httpd.conf
(not sure if related to https://community.sophos.com/products/unified-threat-management/astaroorg/f/75/t/63913 as I don't have SSL scanning enabled-Mantis #20610 )
The issues started 30.3.2012 11.00 AM
Only error I can see is on middleware log (the times are not the same as the high CPU)
2012:03:30-00:10:16 ***** middleware[3523]: >=========================================================================
2012:03:30-00:10:16 ***** middleware[3523]: E Failed: /usr/sbin/tc qdisc del dev eth1.10 parent 1:5 handle 2:
2012:03:30-00:10:16 ***** middleware[3523]:
2012:03:30-00:10:16 ***** middleware[3523]:  1. utils::IPRoute::tc_cmd:949() /utils/IPRoute.pm
2012:03:30-00:10:16 ***** middleware[3523]:  2. utils::IPRoute::tc_qdisc_cmd:919() /utils/IPRoute.pm
2012:03:30-00:10:16 ***** middleware[3523]:  3. utils::IPRoute::tc_qdisc_del:911() /utils/IPRoute.pm
2012:03:30-00:10:16 ***** middleware[3523]:  4. modules::qos::cleanSystem:257() /modules/qos.pm
2012:03:30-00:10:16 ***** middleware[3523]:  5. modules::qos::setAll:157() /modules/qos.pm
2012:03:30-00:10:16 ***** middleware[3523]:  6. core::Config::load:278() /core/Config.pm
2012:03:30-00:10:16 ***** middleware[3523]:  7. main::top-level:221() mdw.pl
2012:03:30-00:10:16 ***** middleware[3523]: >=========================================================================
2012:03:30-00:10:16 ***** middleware[3523]: E Failed: /usr/sbin/tc qdisc del dev eth1.20 parent 1:3 handle 2:
2012:03:30-00:10:16 ***** middleware[3523]:
2012:03:30-00:10:16 ***** middleware[3523]:  1. utils::IPRoute::tc_cmd:949() /utils/IPRoute.pm
2012:03:30-00:10:16 ***** middleware[3523]:  2. utils::IPRoute::tc_qdisc_cmd:919() /utils/IPRoute.pm
2012:03:30-00:10:16 ***** middleware[3523]:  3. utils::IPRoute::tc_qdisc_del:911() /utils/IPRoute.pm
2012:03:30-00:10:16 ***** middleware[3523]:  4. modules::qos::cleanSystem:257() /modules/qos.pm
2012:03:30-00:10:16 ***** middleware[3523]:  5. modules::qos::setAll:157() /modules/qos.pm
2012:03:30-00:10:16 ***** middleware[3523]:  6. core::Config::load:278() /core/Config.pm
2012:03:30-00:10:16 ***** middleware[3523]:  7. main::top-level:221() mdw.pl
or config daemon
2012:03:30-14:14:43 ***** confd[31682]: >=========================================================================
2012:03:30-14:14:43 ***** confd[31682]: E Maximal count of pending signals (120) exceeded at /rpc.pm line 426.
2012:03:30-14:14:43 ***** confd[31682]:
2012:03:30-14:14:43 ***** confd[31682]:  1. sys::_warn:51() /sys.pm
2012:03:30-14:14:43 ***** confd[31682]:  2. sys::_die:57() /sys.pm
2012:03:30-14:14:43 ***** confd[31682]:  3. Astaro::RPC::get_request:426() /rpc.pm
2012:03:30-14:14:43 ***** confd[31682]:  4. Astaro::RPC::server_loop:180() /rpc.pm
2012:03:30-14:14:43 ***** confd[31682]:  5. rpc::launch:50() /rpc.pm
2012:03:30-14:14:43 ***** confd[31682]:  6. main::_rpc:2135() confd.pl
2012:03:30-14:14:43 ***** confd[31682]:  7. main::top-level:394() confd.pl
no /var/storage/cores available.
Thanks

