Guest User!

You are not Sophos Staff.

[8.900][BUG] Flow Monitor: No data available

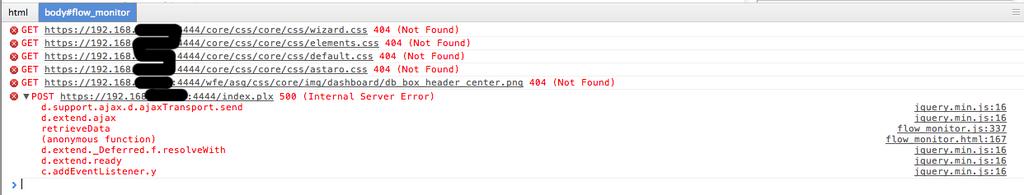
Just opened the "Flow Monitor" and don't get any data. The "No data available in table" doesn't change, even after minutes.

The inspector in my Chrome browser gives back some error messages because files were not found (s. attachment)

Tested browsers (all on Mac):
- Chrome 17.0
- Firefox 10.0
- Safari 5.1

(i have cleared the browser cache many times...)
Parents
  • Could everyone add browser with version to their post?

    Cheers - Bob
     
    Sophos UTM Community Moderator
    Sophos Certified Architect - UTM
    Sophos Certified Engineer - XG
    Gold Solution Partner since 2005
    MediaSoft, Inc. USA
  • I use win7 64bit with google chrome 17.0.963.66

    Robert


    here are some logs, but nothin special in there ...


    ==> confd.log  id="310n" severity="info" sys="System" sub="confd" name="applied changes" user="admin" srcip="10.10.10.12" sid="JKtEnHlfYTlzThTdxVjb" facility="webadmin" client="index.plx" pid="27772" version="335" storage="/cfg"

    ==> mdw.log  starting cycle 330, caught 1 signals
    2012:03:08-12:04:00 firewall middleware[3672]: T core::Config::Changed:132() => configversion=335
    2012:03:08-12:04:00 firewall middleware[3672]: T core::Config::Changed:142() => nodes=0 objects=0 triggers=1
    2012:03:08-12:04:00 firewall middleware[3672]: T core::Config::load:267() => modules=1,2
    2012:03:08-12:04:00 firewall middleware[3672]: T main::top-level:268() => cycle 330 waiting for 1 children
    2012:03:08-12:04:01 firewall middleware[3672]: T main::top-level:257() => ending cycle 330, caught 0 signals, 0 children still running

Reply
  • I use win7 64bit with google chrome 17.0.963.66

    Robert


    here are some logs, but nothin special in there ...


    ==> confd.log  id="310n" severity="info" sys="System" sub="confd" name="applied changes" user="admin" srcip="10.10.10.12" sid="JKtEnHlfYTlzThTdxVjb" facility="webadmin" client="index.plx" pid="27772" version="335" storage="/cfg"

    ==> mdw.log  starting cycle 330, caught 1 signals
    2012:03:08-12:04:00 firewall middleware[3672]: T core::Config::Changed:132() => configversion=335
    2012:03:08-12:04:00 firewall middleware[3672]: T core::Config::Changed:142() => nodes=0 objects=0 triggers=1
    2012:03:08-12:04:00 firewall middleware[3672]: T core::Config::load:267() => modules=1,2
    2012:03:08-12:04:00 firewall middleware[3672]: T main::top-level:268() => cycle 330 waiting for 1 children
    2012:03:08-12:04:01 firewall middleware[3672]: T main::top-level:257() => ending cycle 330, caught 0 signals, 0 children still running

Children
Share Feedback
×

Submitted a Tech Support Case lately from the Support Portal?