

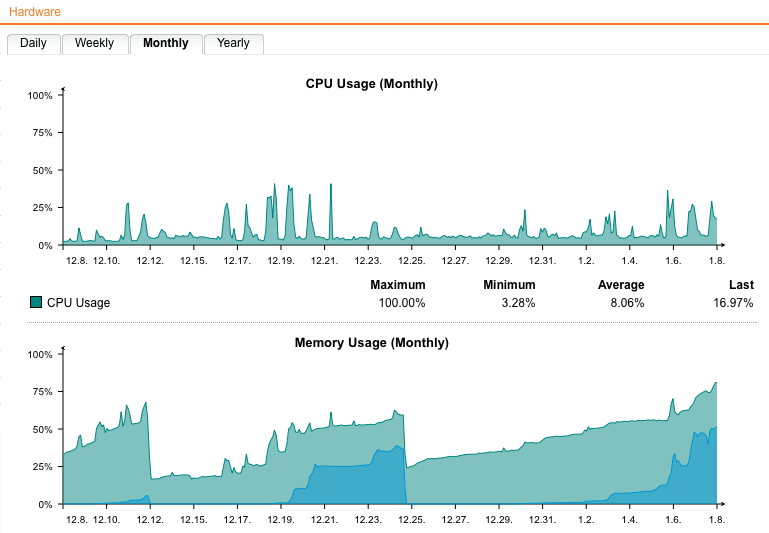
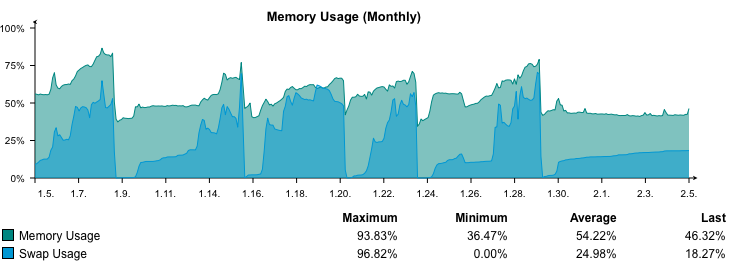
See screenshots for an overview of the memory usage last month and the active modules.
Installation date of the UTM is around 12.8.2013 so this is the complete overview since then. Did a restart twice because of a Up2Date release, which lowered the memory usage to raise again.
Details:
Firmware version: 9.191-2
Pattern version: 55186
System: Hardware UTM120 (2GB)
Updated: Through Up2Date from 9.165 till latest version
Below I inserted the process list from the Support -> Advanced section.
Could this swap problem because by the postgres process? There are several sessions which have a high VSZ.
When there is more info needed, let me know!
(I'm going to reboot tomorrow night, to prevent overload)
USER       PID %CPU %MEM    VSZ   RSS TTY      STAT START   TIME COMMAND

root         2  0.0  0.0      0     0 ?        S     2013   0:00 [kthreadd]

root         3  0.0  0.0      0     0 ?        S     2013   1:33  \_ [ksoftirqd/0]

root         5  0.0  0.0      0     0 ?        S

root      3156  0.0  0.0   1896     0 ?        Ss    2013   0:00 /usr/local/bin/confd-queuer

root      3170  0.0  0.1   8064  2332 ?        Ss    2013   2:28 confd-qrunner.pl

root      3209  0.0  0.1   7804  2644 ?        S     2013  19:06 /usr/local/bin/sysmond

root      3296  0.0  0.0  16108    20 ?        S     2013   0:00 /var/aua/aua.bin

root      3297  0.0  0.0   1896     0 ?        S     2013   0:00  \_ logger -p daemon.debug -t aua[3296]

root       933  0.0  0.0      0     0 ?        Z    20:37   0:00  \_ [aua.bin]

root      3466  0.0  0.0  14544    32 ?        S     2013   0:00 /usr/local/bin/notifier.plx -d

rrdcache  3490  0.0  0.0 118068   240 ?        Ssl   2013  12:38 /usr/bin/rrdcached -l unix:/var/run/rrdcached/socket -m 777 -b /var

at        3524  0.0  0.0   2340    12 ?        Ss    2013   0:00 /usr/sbin/atd

postgres  3602  0.0  0.0 573632   368 ?        S     2013   1:47 /usr/pgsql92/bin/postgres -D /var/storage/pgsql92/data

postgres  3609  0.0  0.7 574000 14344 ?        Ss    2013   5:55  \_ postgres: checkpointer process

postgres  3610  0.0  0.0 573892    44 ?        Ss    2013   0:26  \_ postgres: writer process

postgres  3611  0.0  0.7 573892 14544 ?        Ss    2013  13:48  \_ postgres: wal writer process

postgres  3612  0.0  0.0 574648   964 ?        Ss    2013   3:07  \_ postgres: autovacuum launcher process

postgres  3613  0.0  0.0   7936   136 ?        Ss    2013   0:11  \_ postgres: archiver process   last was 00000001000000060000003F

postgres  3614  0.0  0.0   8216   408 ?        Ss    2013   9:18  \_ postgres: stats collector process

postgres  4290  0.0  0.1 576388  2480 ?        Ss    2013   3:17  \_ postgres: hotspot hotspot 127.0.0.1(37336) idle

postgres  4467  0.7  1.0 576964 21376 ?        Ss    2013 160:19  \_ postgres: reporting reporting [local] idle

postgres  4728  0.0  0.0 576384   636 ?        Ss    2013   0:01  \_ postgres: smtp smtp 127.0.0.1(37356) idle

postgres 14671  0.5  1.2 578236 26396 ?        Ss   00:00   6:48  \_ postgres: reporting reporting [local] idle

postgres 14672  0.0  0.0 576296    20 ?        Ss   00:00   0:00  \_ postgres: reporting reporting [local] idle

postgres 14763  0.0  0.0 576172     8 ?        Ss   00:00   0:00  \_ postgres: reporting reporting [local] idle

postgres   991  0.4  0.1 576408  3544 ?        Ss   20:38   0:16  \_ postgres: smtp smtp 127.0.0.1(34674) idle

root      3700  0.0  0.0  40420    36 ?        S     2013   1:46 /var/mdw/mdw.plx

root      3749  0.0  0.0   1896     0 ?        S     2013   0:00  \_ logger -p daemon.debug -t middleware[3700]

root      3738  0.0  0.0   1920    20 ?        Ss    2013   0:25 runsvdir -P /etc/service log: .....................................

root      3744  0.0  0.0   1776    16 ?        Ss    2013   0:00  \_ runsv selfmonng

root      3745  1.5  0.1  11768  3024 ?        S     2013 328:29      \_ /usr/local/bin/selfmonng.plx

root      3751  0.0  0.0  11360   296 ?        S     2013   0:10          \_ [timewarp check]

root      3739  0.0  0.0   2420     8 tty1     Ss+   2013   0:00 /sbin/mingetty --noclear --no-hostname tty1

root      3740  0.0  0.0   2420     8 tty2     Ss+   2013   0:00 /sbin/mingetty --no-hostname tty2

root      3741  0.0  0.0   2420     8 tty3     Ss+   2013   0:00 /sbin/mingetty --no-hostname tty3

root      3742  0.0  0.0   2420     8 tty4     Ss+   2013   0:00 /sbin/mingetty --no-hostname tty4

root      3743  0.0  0.0   2140     8 ttyS0    Ss+   2013   0:00 /sbin/mingetty ttyS0

root      4193  0.0  0.0   2360   156 ?        Ss    2013   0:09 /usr/sbin/cron

root      4205  0.0  0.4  20652  9648 ?        Ss    2013  17:19 /usr/sbin/named -4

root      4244  0.0  0.0   5016     4 ?        Ss    2013   0:00 /usr/sbin/sshd -f /etc/ssh/sshd_config

root      4253  0.0  0.2  12592  5440 ?        Ss    2013   7:08 dns-resolver.plx

root      4270  0.0  0.3  34724  6180 ?        Ss    2013   7:27 awed [master]

root      4288  0.0  0.0   9580   368 ?        S     2013   0:38 /usr/local/bin/hotspotd

root      4398  0.0  0.0   5116   312 ?        Ss    2013   0:15 /usr/sbin/openvpn --config /etc/openvpn/openvpn.conf --writepid /va

root      4404  0.0  0.0  10876   288 ?        Ss    2013   1:24 /bin/httpd -f /etc/httpd/httpd.conf

root      4406  0.0  0.0   1896   164 ?        S     2013   0:01  \_ /bin/logger -t httpd -p local6.notice

wwwrun    4411  0.0  0.0  10788   136 ?        S     2013   0:03  \_ /bin/httpd -f /etc/httpd/httpd.conf

wwwrun     916  2.7  1.3  81580 28160 ?        S    20:37   1:43  |   \_ /var/webadmin/webadmin.plx

wwwrun     967  2.4  1.6  77456 34548 ?        S    20:38   1:32  |   \_ /var/webadmin/webadmin.plx

wwwrun   10454  0.0  0.1  11260  2464 ?        S    21:35   0:00  \_ /bin/httpd -f /etc/httpd/httpd.conf

wwwrun   10486  0.0  0.1  11196  2400 ?        S    21:35   0:00  \_ /bin/httpd -f /etc/httpd/httpd.conf

root      4461  0.5  0.0 104728  2032 ?        S
