Guest User!

You are not Sophos Staff.

[9.060][CLOSED] High RAM/SWAP Usage

Hi there,

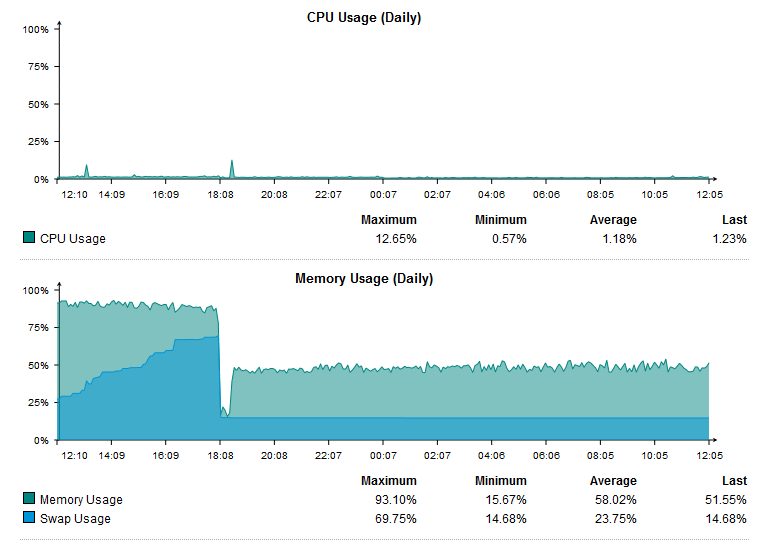
i see verry high RAM/SWAP Usage on my UTM after 6 Day's of uptime.
Anyone any ideas that could be the Problem? 

My UTM is running on VMWare with 6GB of RAM / 1GB Swap (which is full now)

Have a look at RSIZE:


ATOP - firewall                                                      2013/01/25  16:08:49                                                      ---------                                                       10s elapsed
PRC | sys    0.36s | user   0.85s |               |              | #proc    226 | #trun      1 | #tslpi   468 |               | #tslpu     0 | #zombie    2 | clones    59 |               |              | no  procacct |
CPU | sys       3% | user      7% |               | irq       0% |              | idle    388% | wait      1% |               |              | steal     0% | guest     0% |               | curf 2.27GHz | curscal   ?% |
CPL | avg1    0.17 |              |  avg5    5.98 |              | avg15   9.08 |              |              |  csw    47636 |              | intr   26798 |              |               |              | numcpu     4 |
MEM | tot     5.8G | free  353.3M |  cache 330.3M |              | dirty   0.3M | buff    9.4M | slab  114.9M |  slrec  28.7M |              | shmem  75.0M |              | shrss  69.7M  | shswp  34.9M |              |
SWP | tot     1.0G | free    0.1M |               |              |              |              |              |               |              |              |              |               | vmcom   7.1G | vmlim   3.9G |
PAG | scan       0 | steal      0 |               | stall      0 |              |              |              |               |              |              |              |               | swin       8 | swout      0 |
DSK |          sda | busy      3% |               | read       1 | write     77 |              | KiB/r     32 |  KiB/w     12 |              | MBr/s   0.00 | MBw/s   0.09 |               | avq     2.30 | avio 3.38 ms |
NET | transport    | tcpi     400 |  tcpo     414 |              | udpi     142 | udpo     310 | tcpao      1 |  tcppo      6 | tcprs      0 | tcpie      0 |              | tcpor      1  | udpnp      0 | udpip      0 |
NET | network      | ipi      986 |               | ipo     1148 | ipfrw    425 |              | deliv    546 |               |              |              |              |               | icmpi      4 | icmpo      4 |
NET | eth3      0% | pcki     142 |               | pcko     358 | si   12 Kbps | so   51 Kbps | coll       0 |               | mlti       0 | erri       0 | erro       0 |               | drpi       0 | drpo       0 |
NET | eth1      0% | pcki     349 |               | pcko     313 | si   39 Kbps | so   39 Kbps | coll       0 |               | mlti       0 | erri       0 | erro       0 |               | drpi       0 | drpo       0 |
NET | eth0      0% | pcki      74 |               | pcko      87 | si    9 Kbps | so   30 Kbps | coll       0 |               | mlti       0 | erri       0 | erro       0 |               | drpi       0 | drpo       0 |

  PID        TID       MINFLT       MAJFLT       VSTEXT      VSLIBS        VDATA       VSTACK        VSIZE       RSIZE        VGROW        RGROW       SWAPSZ      RUID           EUID            MEM       CMD        1/2
31008          -            2            1        1376K       3544K         1.3G         308K         1.3G      814.6M           0K           0K       312.3M      snort          snort           14%       snort_inline
30880          -            1            0        1376K       3544K         1.1G         136K         1.1G      599.4M           0K           0K       275.3M      snort          snort           10%       snort_inline
30444          -            0            0        1376K       3544K       847.7M         136K       861.0M      574.4M           0K           0K       44776K      snort          snort           10%       snort_inline
 8355          -            0            0          32K      19588K       376.7M         136K       396.8M      316.9M           0K           0K         356K      root           root             5%       cssd
14735          -            1            0         384K      15432K         1.2G         136K         1.2G      211.8M           0K           0K           0K      httpprox       httpprox         4%       httpproxy
 9648          -            0            0        1996K       2500K       75940K         136K       132.2M      65964K           0K           0K       11512K      httpprox       httpprox         1%       urid
 6347          -            0            0          72K       4452K       48624K         136K       58636K      50280K           0K           0K           0K      wwwrun         wwwrun           1%       webadmin.plx
30405          -            0            0        5172K       1940K        2024K         136K         1.1G      37820K           0K           0K         480K      postgres       postgres         1%       postgres
 4839          -            0            0        5172K       2084K        2524K         136K         1.1G      34320K           0K           0K         540K      postgres       postgres         1%       postgres
Parents
  • Looking at the ipslan pic you can see the peaks in the Network traffic when the IPS is turned off.
    So comparing them to the memory usage you can see that at about 12:15 the IPS was turned off and then back on a short time after (maybe 1/2 hour).

    At 18:08 (ish) is when I shut down the IPS and restarted IPS.

    Hope this makes more sense and sorry for the added confusion.

    Mark
Reply
  • Looking at the ipslan pic you can see the peaks in the Network traffic when the IPS is turned off.
    So comparing them to the memory usage you can see that at about 12:15 the IPS was turned off and then back on a short time after (maybe 1/2 hour).

    At 18:08 (ish) is when I shut down the IPS and restarted IPS.

    Hope this makes more sense and sorry for the added confusion.

    Mark
Children
No Data
Share Feedback
×

Submitted a Tech Support Case lately from the Support Portal?