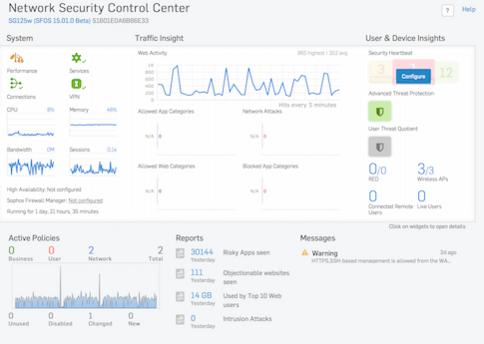
Try following:
1. Allowed App Categories: Configure an Application Filter policy.
2. Allowed Web Categories: Configure a web filter policy.
3. Network Attacks: Since the graph lists hosts that were denied access to the network due to health reasons - you need to configure Security Heartbeat from System > System Services > Security Heartbeat.
4. Blocked App Categories: Again, configure an Application Filter policy blocking certain app categories. This graph shows data only someone tries to access an application falling under a denied app category.
Should you need further information, please do not hesitate to get in touch.


