

With all the fancy dashboard graphs, I am finding that the logging is either too hard to find or lacking in this version. Why don't we have to ability to choose date/time ranges when parsing logs in the web interface of copernicus.
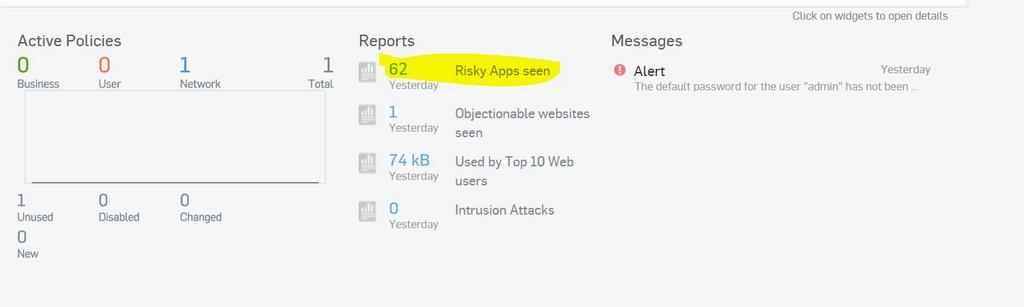
For example, on the dashboard I have 62 risky apps[:O] screenshot1
Lets click on the suspicious apps to see whats going on. I get screenshot2. What??? HTTP ... Really? http is an app now?
Lets go look at the logs ... something must be visible in the logs right? Wrong... screenshot 3. To add insult to injury, I am also told to check the settings because maybe the logging is not enabled. Wow[8-)] I appreciate the link to enable logging but most of the daemons already have logging enabled by default and don't need a reminder to enable logging if the file doesn't exist.
I guess time to pull out putty and manually parse the log files. Aha something in the awarrenhttp.log https://community.sophos.com/products/unified-threat-management/astaroorg/f/67/t/57959 Whats the point of all the fancy graphs if the grunt work has to be done with ssh[:S]
Also I noticed that the files are not being rotated. So one file is going to hold all the logging data indefinitely? Is that intentional?
Regards
Bill


