Guest User!

You are not Sophos Staff.

[8.270][NOTABUG][CLOSED] Services restarting

Beginning a little over 9 hours ago, I got the first of 42 messages:

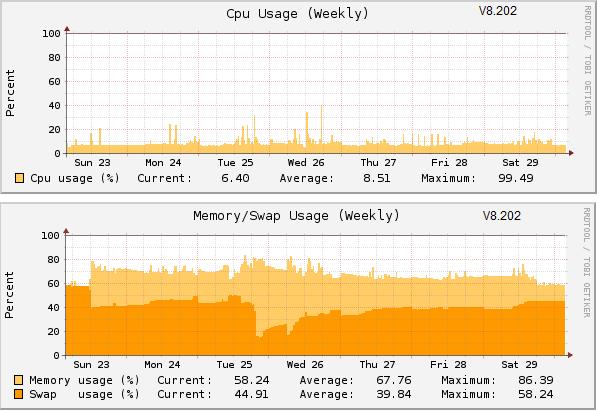
12:28 Middleware not running - restarted
12:28 IM/P2P classifier not running - restarted
12:30 Dhcpd not running - restarted
01:04 Spam filter cannot query database servers
01:29 Dhcpd not running - restarted
01:31 Middleware not running - restarted
[...]
02:39 Service Monitor not running - restarted
[...]
04:22 ACC device agent not running - restarted
[...]
08:41 IM/P2P classifier not running - restarted


After that my laptop could not connect via any VPN, nor could I get answers to ping.  The same was true with my iPhone via the cellular network.

Cheers - Bob
  • wow, this looks bad. Do you have all the services enabled on your ASG? How much ram and how many users? Definitely not stable for production

    Regards
    Bill

    EDIT: Just thought of something... Did you upgrade from the pre-beta release or was it a fresh install of 8.270?
  • Fresh install of 8.270, but the key thing for me is that I also experienced this with 8.202.  There's very low load on this box, and as you can see below, it's been more-than-adequate under 8.202 and 7.511.  Unfortunately, when it locked up under 8.202, I did a reload instead of a config restore, so I deleted the information I would have needed to show that the problem is the same as under the 8.3 beta.


    Cheers - Bob
     
    Sophos UTM Community Moderator
    Sophos Certified Architect - UTM
    Sophos Certified Engineer - XG
    Gold Solution Partner since 2005
    MediaSoft, Inc. USA
  • Yes, you can definitely see a little more stress under 8.2x due to L7 categorization but still not bad. The thing that stands out to me in your 8.270 memory usage graphs is that you exhausted both your memory and swap completely on the 16th and that is before your cpu pegged out at 100 percent suggesting a possible memory leak. Do you have many httpproxy core dumps in /var/storage/core?

    Regards
    Bill
  • No, Bill, in fact, it's empty.  Looking at the 10/17-18 CPU graph above, there were these new-with-V8.2xx peeks every 15 minutes.  Here are some possibly-interesting logs

    There's activity here every 15 minutes:
    2011:11:17-20:09:08 post confd[4395]: I main::top-level:497() => id="310c" severity="info" sys="System" sub="confd" name="node changed" node="notifications->reboot_reason" value="{'0' => 'Rebooted by Up2Date'}" oldvalue="{'0' => ''}" user="system" srcip="127.0.0.1" sid="FhMRkJHCVPPZbEXtuMoT" facility="system" client="auisys.plx" pid="7351"
    
    2011:11:17-20:09:08 post confd[4395]: I main::cleanup_changelog:901() => id="3100" severity="info" sys="System" sub="confd" name="trimmed version 78 from changelog"
    2011:11:17-20:09:08 post confd[4395]: I main::cleanup_changelog:901() => id="3100" severity="info" sys="System" sub="confd" name="trimmed version 79 from changelog"
    2011:11:17-20:09:08 post confd[4395]: I main::cleanup_changelog:901() => id="3100" severity="info" sys="System" sub="confd" name="trimmed version 80 from changelog"
    2011:11:17-20:09:09 post confd[4395]: I main::top-level:710() => id="310n" severity="info" sys="System" sub="confd" name="applied changes" user="system" srcip="127.0.0.1" sid="FhMRkJHCVPPZbEXtuMoT" facility="system" client="auisys.plx" pid="7351" version="82" storage="/cfg"
    2011:11:17-20:09:34 post confd[4395]: I main::top-level:497() => id="310c" severity="info" sys="System" sub="confd" name="node changed" node="notifications->reboot_reason" value="{'0' => ''}" oldvalue="{'0' => 'Rebooted by Up2Date'}" user="system" srcip="127.0.0.1" sid="rxEqyUsmNmDVDdHFggmf" facility="system" client="auisys.plx" pid="7412"
    2011:11:17-20:09:34 post confd[4395]: I main::top-level:710() => id="310n" severity="info" sys="System" sub="confd" name="applied changes" user="system" srcip="127.0.0.1" sid="rxEqyUsmNmDVDdHFggmf" facility="system" client="auisys.plx" pid="7412" version="83" storage="/cfg"


    I logged out of WebAdmin for the day at 19:46:45; the HTTP daemon log ends with:
    2011:11:17-19:46:50 post httpd: 10.x.x.2 - - [17/Nov/2011:19:46:50 -0600] "GET /wfe/asg/js/up2date.js?t=1321580806 HTTP/1.1" 200 820
    
    2011:11:17-19:46:50 post httpd: 10.x.x.2 - - [17/Nov/2011:19:46:50 -0600] "GET /blank.html HTTP/1.1" 304 -
    2011:11:17-19:46:50 post httpd: 10.x.x.2 - - [17/Nov/2011:19:46:50 -0600] "POST /index.plx HTTP/1.1" 200 263
    2011:11:17-19:46:50 post httpd: 10.x.x.2 - - [17/Nov/2011:19:46:50 -0600] "POST /index.plx HTTP/1.1" 200 656
    2011:11:17-19:46:50 post httpd: 10.x.x.2 - - [17/Nov/2011:19:46:50 -0600] "POST /index.plx HTTP/1.1" 200 603


    Cheers - Bob
    PS I just posted another thread about snort restarts every three minutes - the log doesn't seem to correlate with this issue though.
     
    Sophos UTM Community Moderator
    Sophos Certified Architect - UTM
    Sophos Certified Engineer - XG
    Gold Solution Partner since 2005
    MediaSoft, Inc. USA
  • This appears to have happened again as the last email I've received was at 7:17 this morning and I no longer can ping the Astaro.  I guess I'll go in early in the AM to start things up again.  If one of the devs wants me to look at anything specific from the console before I restore a backup, this may be the last opportunity as I may need to drop out of the beta and go back to 7.511 on this box.

    Cheers - Bob
     
    Sophos UTM Community Moderator
    Sophos Certified Architect - UTM
    Sophos Certified Engineer - XG
    Gold Solution Partner since 2005
    MediaSoft, Inc. USA
  • The mystery deepens.  My original post showed that the issue began at 00:28 on 2011-11-18.  At 00:28:09 in the Firewall log, it began to fill (over 830K lines) with drops of DNS requests from the Astaro itself - including even requests to the two OpenDNS forwarders specifically used in the DNS Proxy and our own internal DNS!  Then, abruptly at 14:24:38, the last offending line was to our internal DNS:
    2011:11:18-14:24:38 post ulogd[5037]: id="2001" severity="info" sys="SecureNet" sub="packetfilter" name="Packet dropped" action="drop" fwrule="60003" outitf="eth0" srcmac="0:50:8b:xx:xx:zz" srcip="10.zz.zz.34" dstip="10.zz.zz.7" proto="17" length="93" tos="0x00" prec="0x00" ttl="64" srcport="51946" dstport="53"


    This recommeced at 00:21:19 on the 20th, and didn't slow down until I restored from the 2011-11-16 backup at 11:19.  It was not until another reboot at 12:01 that these crazy entries went away.

    Cheers - Bob
    PS Ouch!  I just noticed that today's DNS log is 237MB (yes MB) - I doubt I could open that successfully with Notepad++.  Searching the file, it appears that all of the entries are network unreachable - no surprise since the firewall was blocking the requests!
     
    Sophos UTM Community Moderator
    Sophos Certified Architect - UTM
    Sophos Certified Engineer - XG
    Gold Solution Partner since 2005
    MediaSoft, Inc. USA
  • Hi Bob,

    Glad you noticed that, because now it explains why my ipv6 tunnel won't come up.

    My DNS log is already at 25MB, and it is only 10AM here. All host unreachable errors. Checked my Firewall log, and it is full of block sourceip the firewall outside interface, destination port 53.

    Something definately flaky here.
  • Hi guys,
    Thanks a lot for your active commitment by testing. 
    Unfortunately we couldn´t recognize the reason for the issue by your discussion above. I would ask you to post more specific information regarding your problem in the future. We have to know which modules could be affected so we need to know about your configuration in details. Furthermore you could help us to investigate the issues by process observing on the console.  At this juncture I would ask for your patience and recommend you to wait till the next release is public so you will have the chance to prove whether the same behavior is still staying or not.

    Have fun,
    Masoumeh
  • I noticed that the problems began, in each case, shortly after the Executive Report was sent.  Here are extracts from the System logs for these days:

    The 18th (yes, the lines from the 17th are in the file in the Astaro, and I did not modify it):
    2011:11:18-00:20:52 astaro report_render[2215]: Daily Executive Report
    
    2011:11:17-19:33:36 astaro rsyslog: action 3 queue[DA]: size=0 enqueued=6514 full=5409 maxqsize=1253 
    2011:11:17-19:33:36 astaro rsyslog: action 3 queue: size=987 enqueued=176631 full=27573 maxqsize=1000 
    2011:11:17-19:33:36 astaro rsyslog: main Q: size=9971 enqueued=104397 full=633 maxqsize=10000 
    2011:11:18-00:22:16 astaro postgres[2294]: [2-1] LOG:  unexpected EOF on client connection
    2011:11:18-00:24:01 astaro /usr/sbin/cron[2623]: (root) CMD (/sbin/audld.plx --trigger)
    2011:11:18-00:25:01 astaro /usr/sbin/cron[2786]: (root) CMD (   /usr/local/bin/reporter/system-reporter.pl)
    2011:11:17-19:38:36 astaro rsyslog: action 3 queue[DA]: size=0 enqueued=6553 full=5448 maxqsize=1253 
    2011:11:18-00:28:11 astaro snmpd[7887]: Received TERM or STOP signal...  shutting down...


    The 21st:
    2011:11:20-00:20:58 astaro report_render[17917]: Daily Executive Report
    
    2011:11:20-00:21:21 astaro snmpd[1572]: Received TERM or STOP signal...  shutting down...
    2011:11:20-00:21:22 astaro snmpd[1572]: snmpd: send_trap: Failure in sendto (Operation not permitted)


    Finally, here are the first lines in each of the System Monitor daemon logfiles - maybe this is what the devs are looking for.

    The 18th:
    2011:11:18-00:28:23 astaro service_monitor[6547]: id="4000" severity="info" sys="System" sub="loadbalancing" name="REF_YecroutbDr ICMP 69.xx.yy.44 changed state to OFFLINE"
    
    2011:11:18-00:28:23 astaro service_monitor[6547]: id="4000" severity="info" sys="System" sub="loadbalancing" name="Set Availability Group REF_YecroutbDr to 69.xx.yy.44"
    2011:11:18-00:28:24 astaro service_monitor[6547]: id="4000" severity="info" sys="System" sub="loadbalancing" name="REF_YecroutbDr ICMP 69.xx.yy.44 changed state to OFFLINE"
    2011:11:18-00:28:32 astaro service_monitor[6547]: id="4000" severity="info" sys="System" sub="loadbalancing" name="Set Availability Group REF_YecroutbDr to 69.xx.yy.44"
    2011:11:18-00:30:10 astaro service_monitor[6547]: id="4000" severity="info" sys="System" sub="loadbalancing" name="Exiting..."
    2011:11:18-00:30:10 astaro service_monitor[4896]: id="4000" severity="info" sys="System" sub="loadbalancing" name="Starting real server checker with 3 threads"
    2011:11:18-00:30:10 astaro service_monitor[4896]: id="4002" severity="info" sys="System" sub="loadbalancing" name="Open ICMPv4 socket"
    2011:11:18-00:30:10 astaro service_monitor[4896]: id="4002" severity="info" sys="System" sub="loadbalancing" name="Open ICMPv6 socket"
    2011:11:18-00:30:10 astaro service_monitor[4896]: id="4002" severity="info" sys="System" sub="loadbalancing" name="Open ICMPv4 socket with source 184.xx.yy.34"
    2011:11:18-00:30:10 astaro service_monitor[4896]: id="4003" severity="error" sys="System" sub="loadbalancing" name="plugin_trace4: Can't resolve k.root-servers.net, using static IP address!"


    2011:11:20-00:21:23 astaro service_monitor[7048]: id="4000" severity="info" sys="System" sub="loadbalancing" name="REF_YecroutbDr ICMP 68.xx.yy.47 changed state to OFFLINE"
    
    2011:11:20-00:21:23 astaro service_monitor[7048]: id="4000" severity="info" sys="System" sub="loadbalancing" name="Set Availability Group REF_YecroutbDr to 68.xx.yy.47"
    2011:11:20-00:21:23 astaro service_monitor[7048]: id="4000" severity="info" sys="System" sub="loadbalancing" name="REF_YecroutbDr ICMP 68.xx.yy.47 changed state to OFFLINE"
    2011:11:20-00:21:25 astaro service_monitor[7048]: id="4000" severity="info" sys="System" sub="loadbalancing" name="Set Availability Group REF_YecroutbDr to 68.xx.yy.47"
    2011:11:20-00:22:54 astaro service_monitor[7048]: id="4000" severity="info" sys="System" sub="loadbalancing" name="Exiting..."
    2011:11:20-00:22:54 astaro service_monitor[19924]: id="4000" severity="info" sys="System" sub="loadbalancing" name="Starting real server checker with 3 threads"
    2011:11:20-00:22:54 astaro service_monitor[19924]: id="4002" severity="info" sys="System" sub="loadbalancing" name="Open ICMPv4 socket"
    2011:11:20-00:22:54 astaro service_monitor[19924]: id="4002" severity="info" sys="System" sub="loadbalancing" name="Open ICMPv6 socket"
    2011:11:20-00:22:54 astaro service_monitor[19924]: id="4002" severity="info" sys="System" sub="loadbalancing" name="Open ICMPv4 socket with source 184.xx.yy.34"
    2011:11:20-00:22:54 astaro service_monitor[19924]: id="4003" severity="error" sys="System" sub="loadbalancing" name="plugin_trace4: Can't resolve f.root-servers.net, using static IP address!"
    2011:11:20-00:22:54 astaro service_monitor[19924]: id="4002" severity="info" sys="System" sub="loadbalancing" name="plugin_trace4: Tracing host f.root-servers.net [192.5.5.241]"


    Cheers - Bob
     
    Sophos UTM Community Moderator
    Sophos Certified Architect - UTM
    Sophos Certified Engineer - XG
    Gold Solution Partner since 2005
    MediaSoft, Inc. USA
  • Next time this happens, can you please try to figure out what services are triggering that load?

    ps ax -o pcpu,cmd|sort -n -r|head
    ps ax -o rss,cmd|sort -n -r|head

    Thanks!
     Ulrich