[8.162][NOTABUG][CLOSED] Executive report -mail Security

Hi All

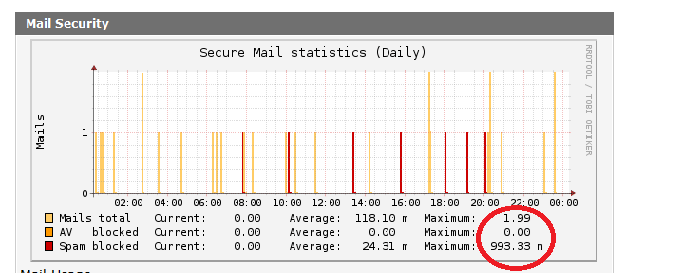
I am having a look at the mail security section from the executive reports (regardsless the version I am running) and I cannot fully understand the numbers. Please see the attached pic.( I would expect the graph to present integer values for max and min as it's counting number of emails) 

How is it possible to get 1.99 email as max on the report? The actual report on the reporting tab of my ASG has an integer number as min/max but this is not the same on the executive report
  • Astaro Beta Report
    --------------------------------
    Version: 8.162
    Type: NOTABUG
    State: CLOSED
    Reporter: wingman
    Contributor: 
    MantisID: 
    Target version: 
    Fixed in version: 
    --------------------------------

  • Is this graph from the beta? I don't have email graphs in the beta, I thought they were gone for some reason.

    The graphs are the averages of different data collected every 5 minutes in the crontab file. From /usr/local/bin/reporter/mailsec-reporter.pl
     
                RRA:AVERAGE:0.5:1:600     
                RRA:AVERAGE:0.5:6:700     
                RRA:AVERAGE:0.5:24:775     
                RRA:AVERAGE:0.5:288:797    
                RRA:MAX:0.5:1:600          
                RRA:MAX:0.5:6:700          
                RRA:MAX:0.5:24:775         
                RRA:MAX:0.5:288:797

    Which translates to 600 samples of 5 minutes  
     700 samples of 30 minutes
     775 samples of 2 hours   
     797 samples of 1 day      

    This just gives you a rough snapshot for a certain 5 minute interval when the graph is drawn. More info can be googled for rrd tool.

    Regards
    Bill.
  • Hi Bill

    indeed this graph is from the executive report from 8.162 (Daily). your answer might explain why  I am seeing 1.99 emails on my graph. However, when the end user looks at the report ,getting 1.99 emails is not ideal and the first think someone might say is that the report is wrong since "I can't have x.y email". Maybe we can fix that on the daily report so to make sense (move the number up/down to the closer integer) ?
  • Wingman, I agree with you totally but the graphing average is not limited to just mail security. If you look at any graphs from concurrent connections to packet filter violations, they are all like this. You just noticed the mail security much easily because you can see only a few mails and the graph is showing something strange.

    I am not so sure if astaro will consider this a bug and fix it though.

    Regards
    Bill.
  • Hi,

    ... I would expect the graph to present integer values for max and min ...


    Which looks totally reasonable at a first glance, but as Bill already explained, the numbers are the result of a statistical aggregation over a period of time. 


    I am not so sure if astaro will consider this a bug and fix it though.


    That "fix" would be to write our own, customized version of the RRDtool. This will not happen any time soon.

    Cheers,
    Kai