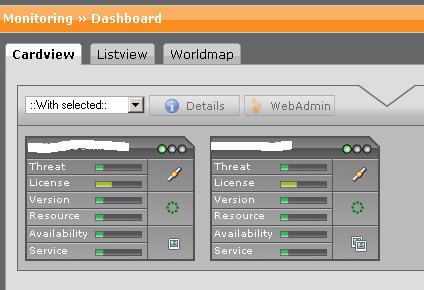
basically this is not a bug. The bargraphs in the dashboard and the level indicators in the listviews are the same. The calculation will take into account not only a single problematic instance but all values which are encompassed by a specific monitoring area.
Hence, it is possible, that even when your memory usage is already nearing some suboptimal region, the overall level for this monitoring area will stay calm as water. As there are many, many instances in the monitoring resource area it might take longer to turn the level to yellow or reddish colors.
We are currently evaluating how to re-arrange the thresholds to be more hysterical so you get earlier warnings. Your feedback is well appreciated.


