

So I have moved from the Cyberoam OS to the XG SFOS (the hardware we have is a number of CR iNG series devices). live traffic reporting in the cyberoam was terrible and I was hoping that the XG firmware was going to improve this.
I am not sure why the data shown on Current Activities > Live Conenctions (sorted by IP) is so useless. If you sort by downstream bandwidth the totals do not add up to anywhere near the activity. The images in this post are from a 10up 10down line. The system graphs in diagnostics show very high use (between 9 and 10 mb consistently) but as you can see the current activities is pretty poor. If you view by application it is even worse.
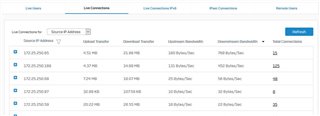
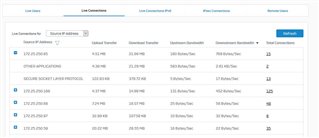
How do you identify in a live environment which IP address is using the majority of the bandwith? Drayteks have a simple data flow monitor that lets you know the bandwidth usage of each active host making it easy to pick out bandwidth hogs. I have assumed that the SFOS alternative was the current activities menus but the data they dispaly is just a waste of time. How do other people identify bandwidth hogs on their XG firewall?
This thread was automatically locked due to age.


