Guest User!

You are not Sophos Staff.

This discussion has been locked.
You can no longer post new replies to this discussion. If you have a question you can start a new discussion

SSL VPN (Remote Access) - terrible latency issues / ping times

Hi,


I am really desperate with my new Sophos XG 85 and seeking your advice. I have successfully setup SSL VPN (Remote Access) on my Sophos XG 85 and users can connect and reach the internal LAN and internet. But as mentioned in the subject users are experiencing  terrible latency issues and ping times are the worst I have ever seen ranging from 70ms to > 1000ms with an average round-trip from 450 ms. It doesn't matter if I am connected via LAN, WIFI or mobile 4G LTE  or if I ping a LAN address like 192.168.100.1 or www.sophos.com. I tried different clients and connected from Windows, Mac OS X and Android. It doesn't make a difference.


My setup is as follows:

[ Internet ] --- [ Router (192.168.2.1) ] --- [ Sophos Port2 (192.168.2.2) ] --- [ Sophos Port1 (192.168.100.1) ] --- [Switch ]  --- [ LAN (192.168.100.0/24) ]


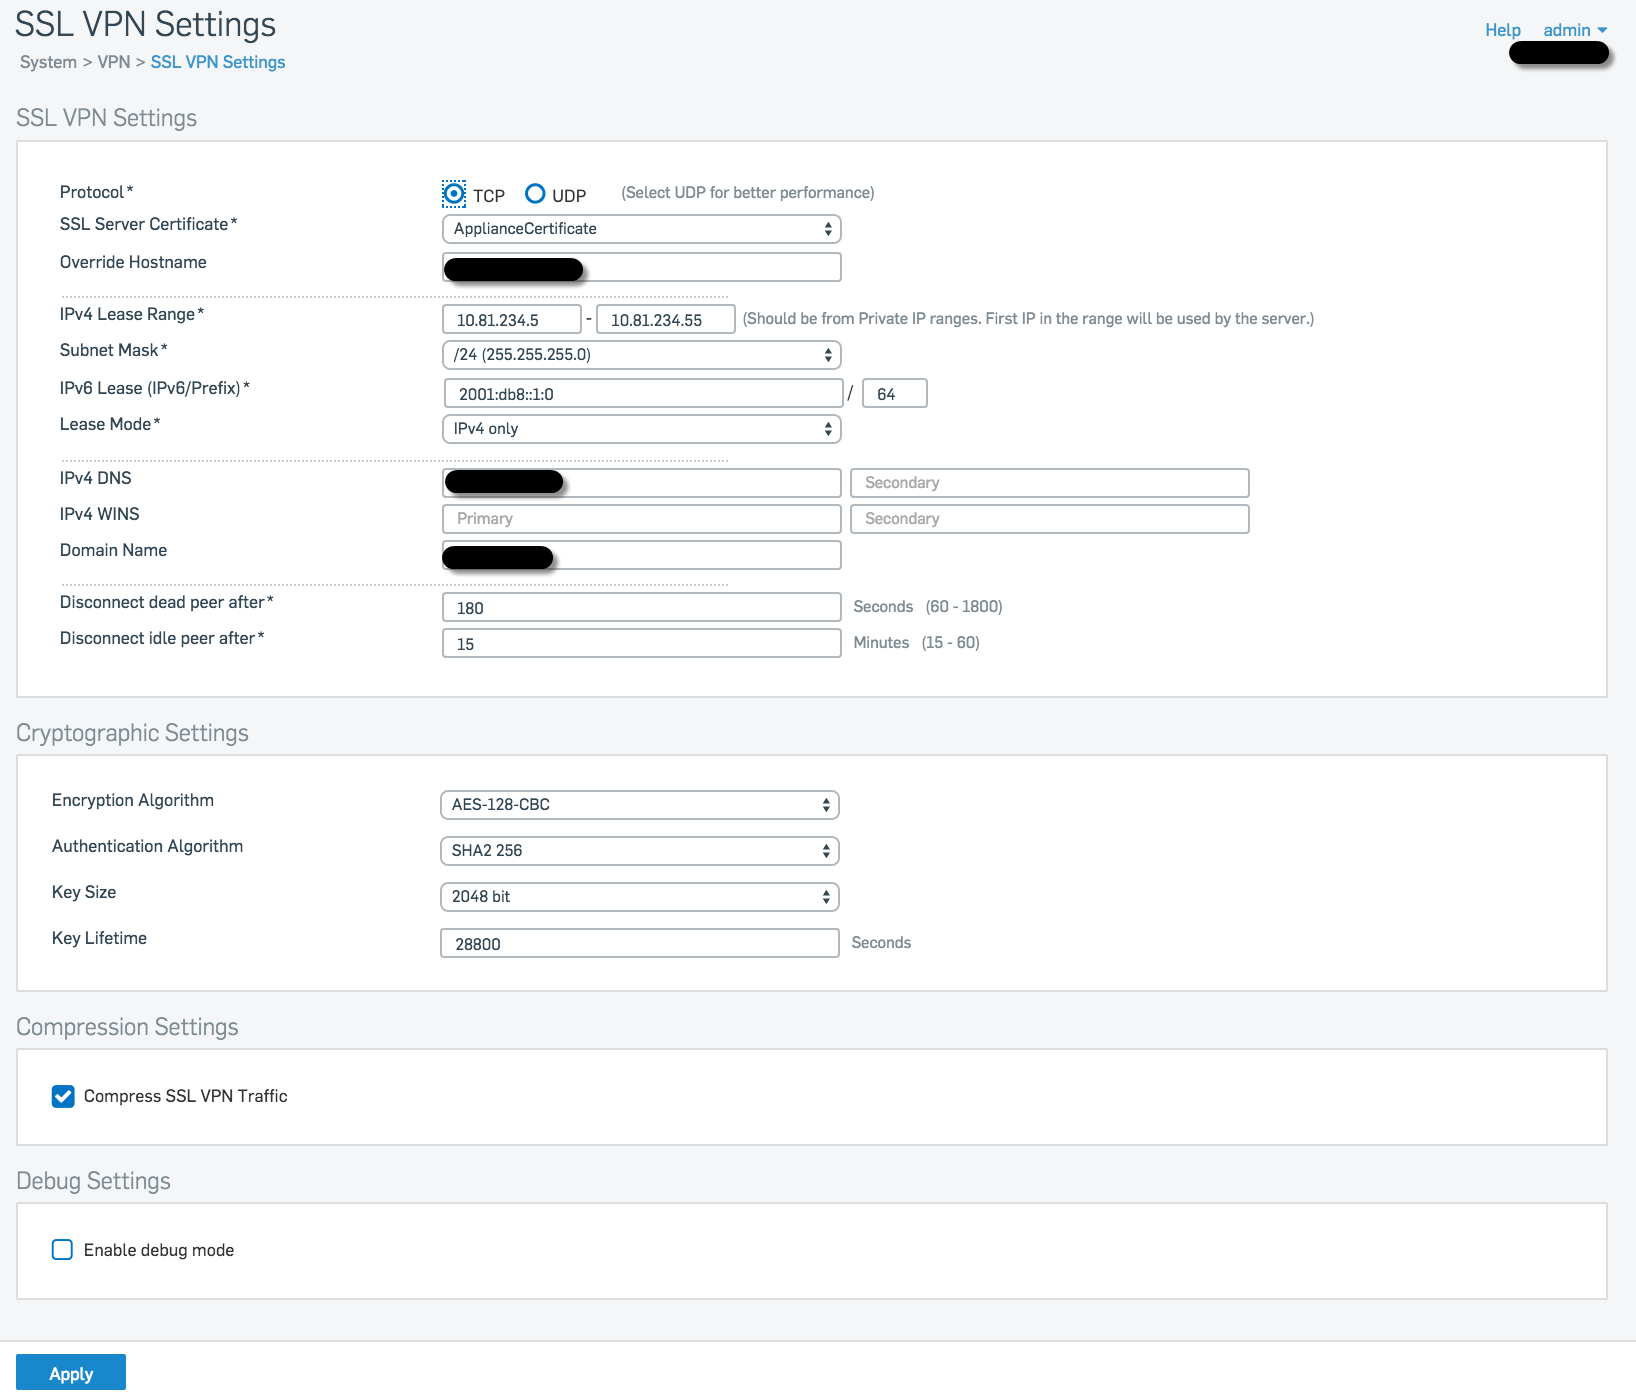
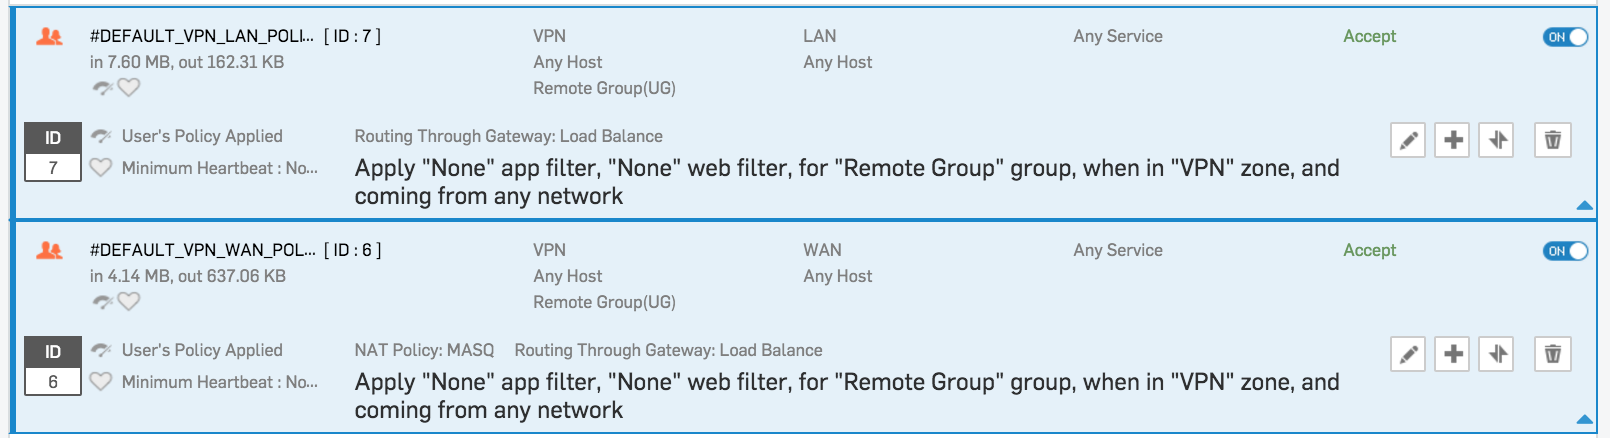
The [ Router ] is forwarding port 8443 to [ Sophos Port2 (192.168.2.2) ] . Enclosed you can find my SSL VPN Setting and the policy I have set up.

Any help is really appreciated.

Regards

Ingo


This thread was automatically locked due to age.
Parents
  • The XG 85 isn't a very powerful box, try unticking the "Compress SSL VPN" traffic and turning the authentication algorithm down to SHA1. The authentication alg is just for message integrity so SHA1 is still suitable for that, it's the encryption algorithm that you'd want to be high if needs be.

    The reason I suggest unchecking the compression is that the box/thread may be getting overloaded because of the compression and would in my eyes be a liable cause of an response spike. If you're able to look at the hardware logs or go into the advanced shell and try and watch the CPU usage against a continuous ping and see if there is a matching spike.

  • Hi,

    I have disabled the compression and changed the authentication algorithm down to SHA1 but no difference.

    Regards
    Ingo

Reply Children
  • As Emile suggested,

    check you CPU and RAM usage from Dashboard or even better from top command. Traceroute indicates that from internal to external network, takes long time. Could you even post a traceroute from an inside computer to 8.8.8.8?

    Luk

  • Also on VPN settings, try to use UPD for better performance.

    Luk

  • Hi Luk,

    CPU & RAM usage are not the matter I think as the are max. 3 concurrent users on the box.

    Here is the output of a top:

    top - 21:27:48 up 1 day,  1:33,  0 users,  load average: 1.75, 1.73, 1.68

    Tasks: 264 total,   1 running, 263 sleeping,   0 stopped,   0 zombie

    Cpu(s):  0.2%us,  0.2%sy,  0.0%ni, 99.7%id,  0.0%wa,  0.0%hi,  0.0%si,  0.0%st

    Mem:   1964072k total,  1514632k used,   449440k free,    60228k buffers

    Swap:        0k total,        0k used,        0k free,   388824k cached

      PID  PR  NI  VIRT  RES  SHR S %CPU %MEM    TIME+  COMMAND                                                                           

     5867  20   0  2832 1216  856 R  0.7  0.1   0:00.07 top

        3  20   0     0    0    0 S  0.3  0.0   0:01.09 ksoftirqd/0

     3976  20   0 31508  26m  956 S  0.3  1.4   0:05.93 dnscache

     5108  20   0 27900  23m 2936 S  0.3  1.2   1:05.34 screenmgr.pl 

        1  20   0  3620  812  692 S  0.0  0.0   0:01.84 init 

        2  20   0     0    0    0 S  0.0  0.0   0:00.00 kthreadd

        5   0 -20     0    0    0 S  0.0  0.0   0:00.00 kworker/0:0H 

        6  20   0     0    0    0 S  0.0  0.0   0:00.01 kworker/u4:0 

        7  20   0     0    0    0 S  0.0  0.0   0:11.92 rcu_sched

        8  20   0     0    0    0 S  0.0  0.0   0:00.00 rcu_bh 

        9  RT   0     0    0    0 S  0.0  0.0   0:00.16 migration/0 

       10  RT   0     0    0    0 S  0.0  0.0   0:00.18 migration/1 

       11  20   0     0    0    0 S  0.0  0.0   0:02.54 ksoftirqd/1

       13   0 -20     0    0    0 S  0.0  0.0   0:00.00 kworker/1:0H 

       14   0 -20     0    0    0 S  0.0  0.0   0:00.00 khelper 

       15   0 -20     0    0    0 S  0.0  0.0   0:00.00 writeback 

       16   0 -20     0    0    0 S  0.0  0.0   0:00.00 bioset 

       17   0 -20     0    0    0 S  0.0  0.0   0:00.00 crypto 

       18   0 -20     0    0    0 S  0.0  0.0   0:00.00 kblockd

       19   0 -20     0    0    0 S  0.0  0.0   0:00.00 ata_sff

       20  20   0     0    0    0 S  0.0  0.0   0:00.00 khubd

       21   0 -20     0    0    0 S  0.0  0.0   0:00.00 md

       23  20   0     0    0    0 S  0.0  0.0   0:00.00 kswapd0 

       24  20   0     0    0    0 S  0.0  0.0   0:00.00 fsnotify_mark

       32  20   0     0    0    0 S  0.0  0.0   0:00.00 scsi_eh_0 

       33   0 -20     0    0    0 S  0.0  0.0   0:00.00 scsi_tmf_0

       34  20   0     0    0    0 S  0.0  0.0   0:00.00 scsi_eh_1

       35   0 -20     0    0    0 S  0.0  0.0   0:00.00 scsi_tmf_1

       36  20   0     0    0    0 S  0.0  0.0   0:00.51 kworker/u4:1 

       38   0 -20     0    0    0 S  0.0  0.0   0:00.00 raid5wq 

       40   0 -20     0    0    0 S  0.0  0.0   0:00.00 deferwq 

       42  20   0     0    0    0 S  0.0  0.0   0:04.34 mmcqd/0

    And here is the traceroute to 8.8.8.8

    $ traceroute 8.8.8.8

    traceroute to 8.8.8.8 (8.8.8.8), 64 hops max, 52 byte packets

     1  192.168.100.1 (192.168.100.1)  1.905 ms  0.799 ms  0.740 ms

     2  192.168.2.1 (192.168.2.1)  1.866 ms  3.634 ms  1.206 ms

     3  87.186.224.193 (87.186.224.193)  23.808 ms  24.188 ms  23.462 ms

     4  87.190.169.26 (87.190.169.26)  27.754 ms  26.695 ms  27.655 ms

     5  217.239.52.150 (217.239.52.150)  25.674 ms  31.285 ms  32.016 ms

     6  87.128.238.134 (87.128.238.134)  25.435 ms  25.291 ms  24.343 ms

     7  209.85.243.109 (209.85.243.109)  24.351 ms  24.616 ms

        209.85.242.91 (209.85.242.91)  25.791 ms

     8  216.239.63.221 (216.239.63.221)  25.606 ms  24.965 ms

        216.239.63.237 (216.239.63.237)  26.935 ms

     9  google-public-dns-a.google.com (8.8.8.8)  24.943 ms  25.118 ms  25.105 ms


    Regards

    Ingo

  • Hi Luk,

    switching to UDP didn't make any difference.

    I finally managed to the "see" the delay by capturing single ping requests with tcpdump from the sophos cli.

    Here are two examples:

    ---
    08:44:51.400941 Port2, IN: IP (tos 0x0, ttl 54, id 48828, offset 0, flags [DF], proto TCP (6), length 40)
        109.84.2.150.35380 > 192.168.2.2.8443: Flags [.], cksum 0x0977 (correct), seq 2352, ack 2059, win 2756, length 0
    !!! DELAY BETWEEN ~ 660 ms !!!
    08:44:52.081198 Port2, IN: IP (tos 0x0, ttl 54, id 48829, offset 0, flags [DF], proto TCP (6), length 187)
        109.84.2.150.35380 > 192.168.2.2.8443: Flags [P.], seq 2352:2499, ack 2059, win 2756, length 147
    08:44:52.081340 tun0, IN: IP (tos 0x0, ttl 64, id 0, offset 0, flags [DF], proto ICMP (1), length 84)
        10.81.234.6 > 192.168.100.2: ICMP echo request, id 138, seq 102, length 64
    08:44:52.081358 Port1, OUT: IP (tos 0x0, ttl 63, id 0, offset 0, flags [DF], proto ICMP (1), length 84)
        10.81.234.6 > 192.168.100.2: ICMP echo request, id 138, seq 102, length 64
    08:44:52.081525 Port1, IN: IP (tos 0x0, ttl 64, id 39872, offset 0, flags [none], proto ICMP (1), length 84)
        192.168.100.2 > 10.81.234.6: ICMP echo reply, id 138, seq 102, length 64
    08:44:52.081541 tun0, OUT: IP (tos 0x0, ttl 63, id 39872, offset 0, flags [none], proto ICMP (1), length 84)
        192.168.100.2 > 10.81.234.6: ICMP echo reply, id 138, seq 102, length 64
    08:44:52.081667 Port2, OUT: IP (tos 0x0, ttl 64, id 36241, offset 0, flags [DF], proto TCP (6), length 187)
        192.168.2.2.8443 > 109.84.2.150.35380: Flags [P.], seq 2059:2206, ack 2499, win 32038, length 147
    ---

    ---
    08:58:58.408868 Port2, IN: IP (tos 0x0, ttl 54, id 50824, offset 0, flags [DF], proto TCP (6), length 40)
        109.84.2.150.35380 > 192.168.2.2.8443: Flags [.], cksum 0xd0d9 (correct), seq 5501, ack 9880, win 3070, length 0
    !!! DELAY BETWEEN ~ 966 ms !!!
    08:58:59.375847 Port2, IN: IP (tos 0x0, ttl 54, id 50825, offset 0, flags [DF], proto TCP (6), length 187)
        109.84.2.150.35380 > 192.168.2.2.8443: Flags [P.], seq 5501:5648, ack 9880, win 3070, length 147    
    08:58:59.376001 tun0, IN: IP (tos 0x0, ttl 64, id 0, offset 0, flags [DF], proto ICMP (1), length 84)
        10.81.234.6 > 192.168.100.2: ICMP echo request, id 138, seq 948, length 64
    08:58:59.376026 Port1, OUT: IP (tos 0x0, ttl 63, id 0, offset 0, flags [DF], proto ICMP (1), length 84)
        10.81.234.6 > 192.168.100.2: ICMP echo request, id 138, seq 948, length 64
    08:58:59.376192 Port1, IN: IP (tos 0x0, ttl 64, id 64934, offset 0, flags [none], proto ICMP (1), length 84)
        192.168.100.2 > 10.81.234.6: ICMP echo reply, id 138, seq 948, length 64
    08:58:59.376208 tun0, OUT: IP (tos 0x0, ttl 63, id 64934, offset 0, flags [none], proto ICMP (1), length 84)
        192.168.100.2 > 10.81.234.6: ICMP echo reply, id 138, seq 948, length 64
    08:58:59.376492 Port2, OUT: IP (tos 0x0, ttl 64, id 37421, offset 0, flags [DF], proto TCP (6), length 187)
        192.168.2.2.8443 > 109.84.2.150.35380: Flags [P.], seq 9880:10027, ack 5648, win 32038, length 147   
    ---


    If I sum up the time from start to end I get exactly the time reported by the ping output. I have no clue what happening between the first two packets. All other timings are pretty good and normal I thing.

    Any hints and help is really really appreciated!

    Thanks and regards
    Ingo

  • I ask myself if I am affected by an old Kernel bug from 2014:

    https://bugzilla.kernel.org/show_bug.cgi
    https://bugzilla.kernel.org/show_bug.cgi?id=73891

    The bug was introduced in Kernel 3.14 and if I look at the Kernel version which is running on my Sophos XG 85 I am feeling a light thrill:

    XG85_XN01_SFOS 15.01.0 MR-1.1# uname -a
    Linux localhost 3.14.22-Aum #1 SMP Mon Feb 22 18:01:05 UTC 2016 i686 GNU/Linux


    Can someone from the official Sophos staff please confirm that this Kernel has the fix applied and is NOT affected?

    Regards
    Ingo

  • Ingo,

    can you try another VPN protocol on your XG and compare the tcpdump output file?

    Luk

  • Hi Luk,

    I connected via IPSec/L2TP but as mentioned before this doesn't make a difference. Ping stays bad an unstable ranging from 75 ms to > 1000 ms.
    Here is the tcpdump from a single ping to internal LAN address 192.168.100.2:

    19:32:09.160448 ppp0, IN: IP (tos 0x0, ttl 128, id 3682, offset 0, flags [none], proto ICMP (1), length 60)
        10.10.10.1 > 192.168.100.2: ICMP echo request, id 1, seq 140, length 40
    19:32:09.160550 Port1, OUT: IP (tos 0x0, ttl 127, id 3682, offset 0, flags [none], proto ICMP (1), length 60)
        10.10.10.1 > 192.168.100.2: ICMP echo request, id 1, seq 140, length 40
    19:32:09.161277 Port1, IN: IP (tos 0x0, ttl 64, id 59284, offset 0, flags [none], proto ICMP (1), length 60)
        192.168.100.2 > 10.10.10.1: ICMP echo reply, id 1, seq 140, length 40
    19:32:09.161309 ppp0, OUT: IP (tos 0x0, ttl 63, id 59284, offset 0, flags [none], proto ICMP (1), length 60)
        192.168.100.2 > 10.10.10.1: ICMP echo reply, id 1, seq 140, length 40

    Ingo

  • Hello,

    Did someone solve this problem ?

    Because I have the exactly same issue, ping response are between 50ms and 1200ms on my Sophos XG85w with SSL VPN.

    With PPTP it's worse, I got timeout error every 15 ping.

    Thank you for you help

  • When experiencing bad ping times:

    -What bandwidth is used on internet?
    -What is WAN speed?

    A DSL modem has pretty large buffers,  filling up its upload will make everything pretty slow.

  • Hello and thank you for your answer,

    When I'm copying files on the NAS, the ping response explode when no activity, ping response is stable around 30ms.

    Bandwidth speeds are the following, on the site with Sophos XG DL:40Mbit/s UL:10 MBit/s. And the remote site it's DL:240Mbit/s UL:20Mbit/s.

    With the VPN connection on, I'm copying files on the NAS at 200ko/s. Sometimes it reach a peak at 1Mo/s and crash again sometimes below 100ko/s.

    On the Sophos WAN Port is configured as 100Mb Full duplex.