Guest User!

You are not Sophos Staff.

This discussion has been locked.
You can no longer post new replies to this discussion. If you have a question you can start a new discussion

Sophos XG Monitoring HA

Hello Sophos and Community,

this topic seems to be an problem for a long time and i have tried to figure out how but i just seems, that there is no way.

We are using the Sophos XG Web API which is for at least some part documented (https://docs.sophos.com/nsg/sophos-firewall/19.0/API/index.html).

We Deploy alot of system with HA and we see that seems to failing at some point without anyone noticing. This really is a common problem Sophos should fix!

Now we are trying to monitor, monitor an HA status and i don't understand why there is no way to do, if so.

We can get the HAConfiguration via the API with "HAConfigure" but does not contain any status.

For example, this is an output of a failed HA via API:

<Response APIVersion="1900.1" IPS_CAT_VER="0">
  <Login>
    <status>Authentication Successful</status>
  </Login>
  <HAConfigure transactionid="">
    <HA_Interactive>
      <Device>Active_Passive</Device>
      <PeerAdministrationList>
  <PeerConfiguration>
    <IPAddressV4>10.4.31.253</IPAddressV4>
    <IPAddressV6 />
    <Interface>Port1</Interface>
    <ReserveBridgePort />
  </PeerConfiguration>
</PeerAdministrationList>
      <ClusterID>0</ClusterID>
      <Passphrase
passwordform="encrypt">THISISSECRET
04</Passphrase>
      <DedicatedLink>Port4</DedicatedLink>
      <DedicatedLinkIPAddress>169.254.192.2</DedicatedLinkIPAddress>
      <KeepAlive_Interval>250</KeepAlive_Interval>
      <KeepAlive_Attempts>16</KeepAlive_Attempts>
      <HostMAC>Disable</HostMAC>
      <FallbackPrimaryDevice>Enable</FallbackPrimaryDevice>
    </HA_Interactive>
  </HAConfigure>
</Response>

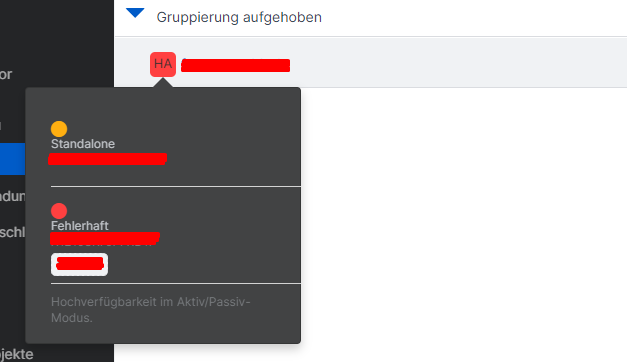
And this is a screenshot from the Dashboard:

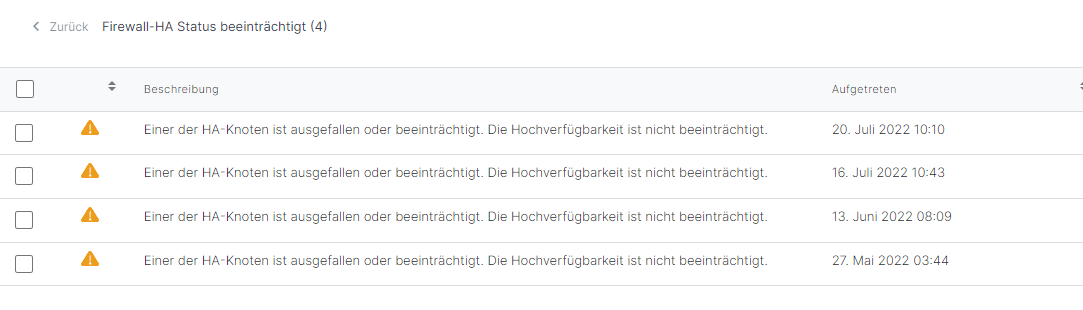
Seems good. Well but take a closer look and check the HA Status:

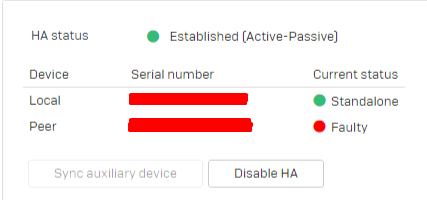
This does not look nice :) And knowbody knows, if not manually looking.

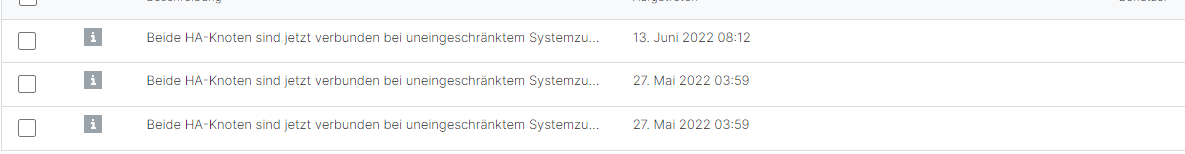
Did anyone get any kind of HA status from the XG. I tried monitoring the Interface, but it is just gone as via the api if you configure HA.

I have no idea left and this is something we really should monitor. We deploy HA systems and they just fail silently, that's a problem!

Thank your for any help. And Sophos. Please fix this.


This thread was automatically locked due to age.
Parents Reply Children
  • Hey Lucar, i will give that a shot aswell. The i am really hoping that at some point you can actually do and monitor xg's via central api. 
    Thanks for the the idea. I do not like the concept of monitoring a log insteaed of of the actual current status, but i guess it is better than nothing.
    I just don't understand why the sophos xg web api is lacking alot of features and there are a lot of bugs ;) Would be nice to have a single source of monitoring :)

  • I do not see the bug in your initial post. Because the API is a configuration API, not a status API. This means, you do not have access to some of those live events and status updates of certain parts of the hardware.

    Nevertheless, Central API will be extended by firewall API. There "should" be a HA flag in Central as well. 

    __________________________________________________________________________________________________________________

  • I did not say that there is bug. But there are alot and just wrong documentation.
    Something like this, just as one of alot examples:

    I read "Datatype" is INTEGER. Expecting a Number with Range of 0 - 2 as explained in the Note.

    The Actual Result is a String containing Enable, Disable Grinning

    You just can't trust the api documentation Slight smile

  • I checked the central the approach, but i am "stucked".

    We have a faulty HA Status in Central, which is actually shown in the firewall status:

    I crawled through all central events on this specific customer as a test but could not find any "fail" event.

    There are not that much firewall events and i found those 4:

    But they explicitly said the HA Status is not impared, which could be happen on a failover or firmware update or just a reboot. It is a warning, which at least for me says: everything is, but one note is rebooting or do i missunderstand? And it seems to happen 4 times with a recover after that, i found the recover events, but not for every date:

    Seems to be No Recover Event for Juli 16. and Juli 20. But two 2 the 27. Mai.

    Do you have any more details about the event you mean?

    Thank you.

  • Did you or somebody eventually cleared the alert? Because the alert should be generated on those dates as you can see. 

    __________________________________________________________________________________________________________________

Share Feedback
×

Submitted a Tech Support Case lately from the Support Portal?