Guest User!

You are not Sophos Staff.

This discussion has been locked.
You can no longer post new replies to this discussion. If you have a question you can start a new discussion

What computer is using all the bandwidth?

XG135/SFOS v19.0

Was working remotely when suddenly I could no longer keep RDP sessions running through the VPN. 100/100 bandwidth. Latency through the tunnel up to 4 or 5 seconds. Ping to WAN IP also ultra-high latency, so I figured something was up. Couldn't get to the firewall console to check on it until it settled down, which took about 30 minutes. Once I was able to get in to the console, I saw 95+Mbps inbound bandwidth used for about 30 minutes starting at the time my RDP session dropped and ending when latency went back to normal.

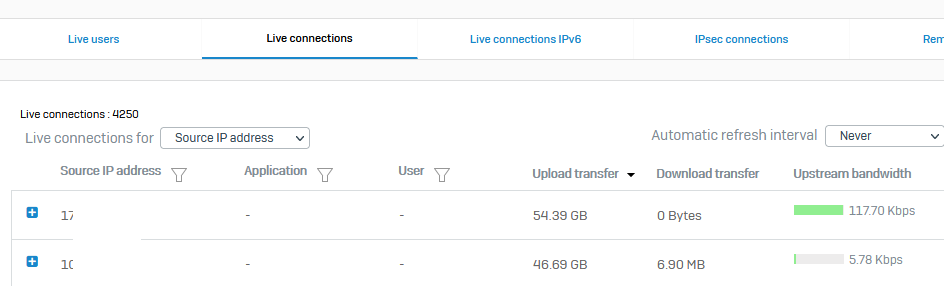
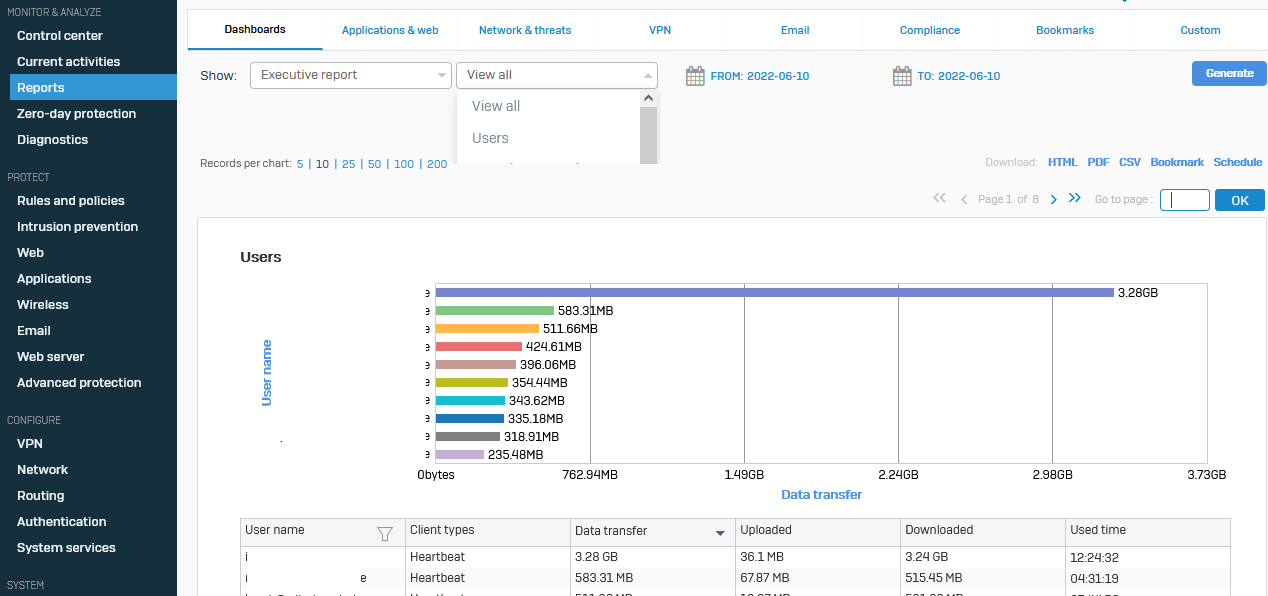
Lots of graphs showing the bandwidth utilization, but no information I could see about what LAN & WAN IPs were involved. I poked around hoping to find a way to find out what machine was using all the bandwidth, but couldn't figure it out. How would I do that, particularly after-the-fact?

TIA


This thread was automatically locked due to age.
  • Reports gets me there...kinda. But the biggest bandwidth activity I can find for any user or URL today is <500MB. 30 minutes at 94Mbps is about 20GB. So that doesn't account for it. Also, there's no QoS at this site, so how did 1 client grab all that bandwidth to the exclusion of all others? Trying to figure out where to go from here.

  • In Reporting (on-appliance if you have it, in Sophos Central if not), you could create a graph of Bandwidth Usage and switch the graph to display Date-Bytes-Source IP.

  • Thanks, Wayne! Sorry for the noob question, but I'm guessing I'd create this Bandwidth Usage graph in Reports/Custom? I'm not seeing a way to do that. (Much less display Date-Bytes-Source IP, but hopefully I can figure that out once I get to it.)

    It does seem that I should see SOMETHING that's about 20GB in the top users & top hosts reports, wouldn't I? The biggest number I see is 570MB. That would d/l in under a minute at 100Mbps. We're talking about a download that's 40X that size. None of the other clients or hosts are anywhere near 570MB. In aggregate they're not even 1GB. How could a d/l that big show up in bandwidth usage graphs but not show up in top users & top hosts?

  • I only use Sophos Central, since the bottom of the line XGS87 doesn't have memory to do reporting. In Sophos Central, you go to Firewall Management > Report Generator, then choose the firewall and the default report is Bandwidth Usage. This breaks things down by Application. But you can go into the tool icon dropdown (on the graph) and choose Date-Bytes-Source IP (rather than the default Date-Bytes-Application). Remember, this is reporting, not Logs.

    Also, the little table-with-plus icon on the top right of the table (below the graph) lets you do things like choose Source IP and Destination IP. Bytes is always selected and can't be changed. The idea is, the less you put in there, the more aggregation takes place.

  • OK, thanks. I was working in the firewall's web console. I'll do this in Central.

  • I'm sure you can do it on the Firewall, I just don't know what the interface looks like. (Another advantage of Central is that it saves stuff for 30 days.)

  • I found it, and thanks for pointing me in this direction...still not seeing anything to account for 20GB. In fact, I downloaded a 5.5GB ISO earlier in the day (without bringing the WAN connection to its knees, and I'm not seeing that traffic either. I need to play with this some more.

  • Yeah, I had a mysterious incident the other day where something like 120GB of data hit my XGS. I didn't see that kind of traffic on any LAN, just on the WAN. Getting into the Advanced Shell, I was able to confirm the amount of traffic, but never figured out where it was going -- or even if it actually entered my network or whether it was all dropped by the firewall. (I.e. only hit the WAN interface but didn't go anywhere.) My ISP claims they couldn't see the surge at their end. Very mysterious.

  • I'm basically seeing the same data in Central that I do in the firewall console, just sliced differently. I still can't see my own, known 5.5GB download from an hour prior to the mystery download. So, either I don't know where to look, or SFOS doesn't know how to tell me. Hoping for the former, I will open a ticket with Sophos.

  • this task is indeed very difficult to identify.

    you can check here, but the values are very inacurate.

    do you have authenticated users on the firewall, synchronized security?

    you could then use this graph

Share Feedback
×

Submitted a Tech Support Case lately from the Support Portal?