Guest User!

You are not Sophos Staff.

This discussion has been locked.
You can no longer post new replies to this discussion. If you have a question you can start a new discussion

Help with "Invalid Traffic" in logs

Hi,

We have an XG 135 running SFOS 18.5.3 MR-3-Build408. There are two gateways, a primary and backup.

One of our users is encountering an intermittent timeout on a specific website when performing a specific action. I have been checking our firewall logs as well as our internal DNS logs but have yet to track it down.

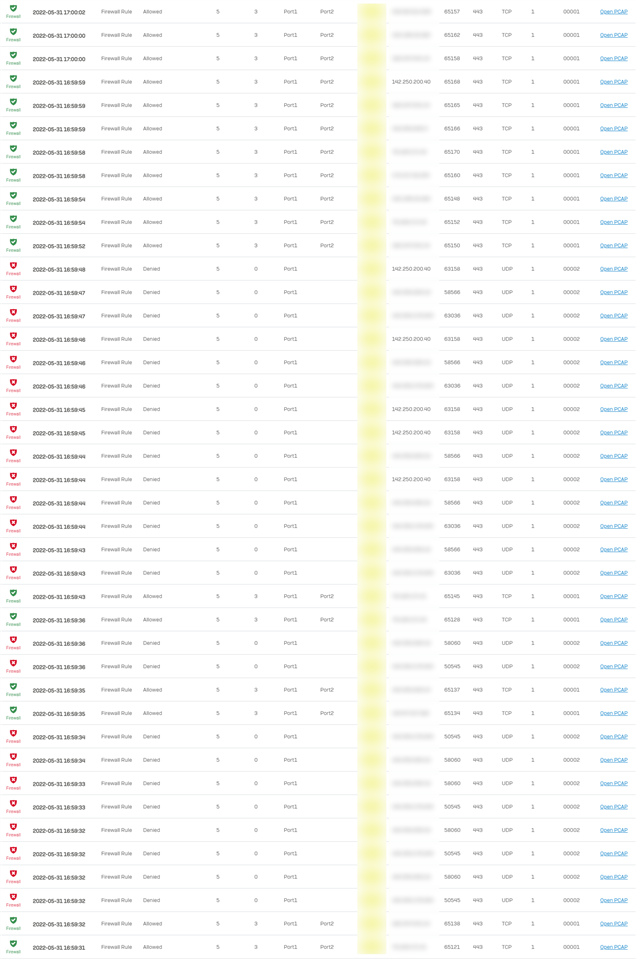
However, there is one thing that caught my eye. Around the time of the failures I'm seeing 5 or 6 sequential entries in the log titled "Invalid Traffic" with the message being "Invalid Packet". These seem to be going to Google or Microsoft servers. This is likely coincidental as it occurs on other PCs too but I would like to rule it out if possible.

In general I'm seeing a mixture of "Invalid Packet" and "Could not associate packet to any connection." when I filter all traffic by "Log comp is Invalid traffic".

I would appreciate any comments.

Thanks,

Alan


This thread was automatically locked due to age.
Parents
  • Hello ,

    Thank you for reaching out to the community, 
    The following article and the solution to mitigate  the situation is provided here: https://docs.sophos.com/nsg/sophos-firewall/18.5/Help/en-us/webhelp/onlinehelp/AdministratorHelp/Logs/LogViewer/InvalidTrafficEvents/index.html


    Thanks & Regards,
    _______________________________________________________________

    Vivek Jagad | Team Lead, Global Support & Services 


    Sophos Community | Product Documentation | Sophos Techvids | SMS
    If a post solves your question please use the 'Verify Answer' button.

  • actually this article will not help. you need to conntrack the connections and that is a difficult task.

    I've seen this yesterday at one of my XGS136 with 18.5 MR3 and I have not seen that with MR2.

    Here it is traffic beeing generated by the XGS itself to WAN or devices connecting to the XG, even my webadmin session.

    The firewall log contains almost 99% Invalid Traffic and Invalid TCP state logs only.

    I have only one WAN gateway.

     do you have a lag / LACP configured on your XG and is this a HA A/P cluster?

    I wonder if it has to do with a LAG bug that came with MR3.

  • Check for IPS updates in the logs and if you see those "Could not associate packet to any connection." messages appear shortly after.

    The last IPS update was "09:16:00, May 31 2022". There were several of these "could not associate" messages a couple of minutes later but they are extremely frequent - there seems to be a block of them every minute or two. I also note that some of them have an "In Interface" associated with them, but most do not.

  • Do a conntrack -E |grep IP 

    Then reproduce the issue or wait for this issue to occur. You should see the connection maybe closed. 

    __________________________________________________________________________________________________________________

  • I have followed your advice and pasted outputs below. However, see also the end of my message for some new information about the main problem that I'm trying to solve.

    I have reproduced the "Invalid packet" behaviour here where a.a.a.a is one of our servers that I first identified in the GUI log and b.b.b.b is our WAN IP. The original destination (52.97.179.226) appears to be a Microsoft IP.

    GUI Firewall Output

    2022-06-01 06:46:04Firewall
    messageid="01001"
    log_type="Firewall"
    log_component="Invalid Traffic"
    log_subtype="Denied"
    status="Deny"
    con_duration="0"
    fw_rule_id="N/A"
    nat_rule_id="0"
    policy_type="0"
    user=""
    user_group=""
    web_policy_id="0"
    ips_policy_id="0"
    appfilter_policy_id="0"
    app_name=""
    app_risk="0"
    app_technology=""
    app_category=""
    vlan_id=""
    ether_type="IPv4 (0x0800)"
    bridge_name=""
    bridge_display_name=""
    in_interface="Port1"
    in_display_interface="Port1"
    out_interface=""
    out_display_interface=""
    src_mac="00:00:00:00:00:00"
    dst_mac=""
    src_ip="a.a.a.a"
    src_country="R1"
    dst_ip="52.97.219.226"
    dst_country="GBR"
    protocol="TCP"
    src_port="41402"
    dst_port="993"
    packets_sent="0"
    packets_received="0"
    bytes_sent="0"
    bytes_received="0"
    src_trans_ip=""
    src_trans_port="0"
    dst_trans_ip=""
    dst_trans_port="0"
    src_zone_type=""
    src_zone=""
    dst_zone_type=""
    dst_zone=""
    con_direction=""
    con_id=""
    virt_con_id=""
    hb_status="No Heartbeat"
    message="Invalid packet."
    appresolvedby="Signature"
    app_is_cloud="0"

    Conntrack Output

    [NEW] proto=tcp proto-no=6 timeout=120 state=SYN_SENT orig-src=a.a.a.a orig-dst=52.97.179.226 orig-sport=37190 orig-dport=993 [UNREPLIED] reply-src=52.97.179.226 reply-dst=b.b.b.b reply-sport=993 reply-dport=37190 mark=0x8001 id=1941491456 masterid=0 devin=Port1 devout=Port2 nseid=16784884 ips=3 sslvpnid=0 webfltid=4 appfltid=0 icapid=0 policytype=1 fwid=5 natid=3 fw_action=1 bwid=0 appid=0 appcatid=0 hbappid=0 hbappcatid=0 dpioffload=0 sigoffload=0 inzone=1 outzone=2 devinindex=5 devoutindex=6 hb_src=0 hb_dst=0 flags0=0x10800a080020000a flags1=0xd0020a00010 flagvalues=1,3,21,35,41,43,55,60,68,85,87,93,104,106,107 catid=0 user=0 luserid=0 usergp=0 hotspotuserid=0 hotspotid=0 dst_mac=11:11:11:11:11:11 src_mac=00:00:00:00:00:00 startstamp=1654062421 microflow[0]=INVALID microflow[1]=INVALID hostrev[0]=0 hostrev[1]=0 ipspid=0 diffserv=0 loindex=6 tlsruleid=0 ips_nfqueue=1 sess_verdict=0 gwoff=0 cluster_node=0 current_state[0]=11038 current_state[1]=0 vlan_id=0 inmark=0x0 brinindex=21 sessionid=1430 sessionidrev=7201 session_update_rev=1 dnat_done=0 upclass=0:0 dnclass=0:0 pbrid_dir0=0 pbrid_dir1=0 nhop_id[0]=65535 nhop_id[1]=65535 nhop_rev[0]=0 nhop_rev[1]=0 conn_fp_id=NOT_OFFLOADED
    [UPDATE] proto=tcp proto-no=6 timeout=60 state=SYN_RECV orig-src=a.a.a.a orig-dst=52.97.179.226 orig-sport=37190 orig-dport=993 reply-src=52.97.179.226 reply-dst=b.b.b.b reply-sport=993 reply-dport=37190 mark=0x8001 id=1941491456 masterid=0 devin=Port1 devout=Port2 nseid=16784884 ips=3 sslvpnid=0 webfltid=4 appfltid=0 icapid=0 policytype=1 fwid=5 natid=3 fw_action=1 bwid=0 appid=0 appcatid=0 hbappid=0 hbappcatid=0 dpioffload=0 sigoffload=0 inzone=1 outzone=2 devinindex=5 devoutindex=6 hb_src=0 hb_dst=0 flags0=0x10800a080020000a flags1=0xd0020a00010 flagvalues=1,3,21,35,41,43,55,60,68,85,87,93,104,106,107 catid=0 user=0 luserid=0 usergp=0 hotspotuserid=0 hotspotid=0 dst_mac=11:11:11:11:11:11 src_mac=00:00:00:00:00:00 startstamp=1654062421 microflow[0]=INVALID microflow[1]=INVALID hostrev[0]=0 hostrev[1]=0 ipspid=0 diffserv=0 loindex=6 tlsruleid=0 ips_nfqueue=1 sess_verdict=0 gwoff=0 cluster_node=0 current_state[0]=11038 current_state[1]=11038 vlan_id=0 inmark=0x0 brinindex=21 sessionid=1430 sessionidrev=7201 session_update_rev=1 dnat_done=0 upclass=0:0 dnclass=0:0 pbrid_dir0=0 pbrid_dir1=0 nhop_id[0]=65535 nhop_id[1]=65535 nhop_rev[0]=0 nhop_rev[1]=0 conn_fp_id=NOT_OFFLOADED
    [UPDATE] proto=tcp proto-no=6 timeout=10800 state=ESTABLISHED orig-src=a.a.a.a orig-dst=52.97.179.226 orig-sport=37190 orig-dport=993 reply-src=52.97.179.226 reply-dst=b.b.b.b reply-sport=993 reply-dport=37190 [ASSURED] mark=0x8001 id=1941491456 masterid=0 devin=Port1 devout=Port2 nseid=16784884 ips=3 sslvpnid=0 webfltid=4 appfltid=0 icapid=0 policytype=1 fwid=5 natid=3 fw_action=1 bwid=0 appid=0 appcatid=0 hbappid=0 hbappcatid=0 dpioffload=0 sigoffload=0 inzone=1 outzone=2 devinindex=5 devoutindex=6 hb_src=0 hb_dst=0 flags0=0x10800a080020000a flags1=0xd0020a00010 flagvalues=1,3,21,35,41,43,55,60,68,85,87,93,104,106,107 catid=0 user=0 luserid=0 usergp=0 hotspotuserid=0 hotspotid=0 dst_mac=11:11:11:11:11:11 src_mac=00:00:00:00:00:00 startstamp=1654062421 microflow[0]=INVALID microflow[1]=INVALID hostrev[0]=0 hostrev[1]=0 ipspid=0 diffserv=0 loindex=6 tlsruleid=0 ips_nfqueue=1 sess_verdict=0 gwoff=0 cluster_node=0 current_state[0]=11038 current_state[1]=11038 vlan_id=0 inmark=0x0 brinindex=21 sessionid=1430 sessionidrev=7201 session_update_rev=1 dnat_done=0 upclass=0:0 dnclass=0:0 pbrid_dir0=0 pbrid_dir1=0 nhop_id[0]=65535 nhop_id[1]=65535 nhop_rev[0]=0 nhop_rev[1]=0 conn_fp_id=NOT_OFFLOADED
    [UPDATE] proto=tcp proto-no=6 timeout=120 state=FIN_WAIT orig-src=a.a.a.a orig-dst=52.97.179.226 orig-sport=37190 orig-dport=993 reply-src=52.97.179.226 reply-dst=b.b.b.b reply-sport=993 reply-dport=37190 [ASSURED] mark=0x8001 id=1941491456 masterid=0 devin=Port1 devout=Port2 nseid=16784884 ips=3 sslvpnid=0 webfltid=4 appfltid=0 icapid=0 policytype=1 fwid=5 natid=3 fw_action=1 bwid=0 appid=0 appcatid=0 hbappid=0 hbappcatid=0 dpioffload=0x3e sigoffload=0 inzone=1 outzone=2 devinindex=5 devoutindex=6 hb_src=0 hb_dst=0 flags0=0x10800a080020000a flags1=0x1d0120a10010 flagvalues=1,3,21,35,41,43,55,60,68,80,85,87,93,96,104,106,107,108 catid=83 user=0 luserid=0 usergp=0 hotspotuserid=0 hotspotid=0 dst_mac=11:11:11:11:11:11 src_mac=00:00:00:00:00:00 startstamp=1654062421 microflow[0]=INVALID microflow[1]=INVALID hostrev[0]=0 hostrev[1]=0 ipspid=0 diffserv=0 loindex=6 tlsruleid=0 ips_nfqueue=1 sess_verdict=0 gwoff=0 cluster_node=0 current_state[0]=11038 current_state[1]=11038 vlan_id=0 inmark=0x0 brinindex=21 sessionid=1430 sessionidrev=7201 session_update_rev=7 dnat_done=0 upclass=0:0 dnclass=0:0 pbrid_dir0=0 pbrid_dir1=0 nhop_id[0]=65535 nhop_id[1]=65535 nhop_rev[0]=0 nhop_rev[1]=0 conn_fp_id=NOT_OFFLOADED
    [UPDATE] proto=tcp proto-no=6 timeout=10 state=CLOSE_WAIT orig-src=a.a.a.a orig-dst=52.97.179.226 orig-sport=37190 orig-dport=993 reply-src=52.97.179.226 reply-dst=b.b.b.b reply-sport=993 reply-dport=37190 [ASSURED] mark=0x8001 id=1941491456 masterid=0 devin=Port1 devout=Port2 nseid=16784884 ips=3 sslvpnid=0 webfltid=4 appfltid=0 icapid=0 policytype=1 fwid=5 natid=3 fw_action=1 bwid=0 appid=0 appcatid=0 hbappid=0 hbappcatid=0 dpioffload=0x3e sigoffload=0 inzone=1 outzone=2 devinindex=5 devoutindex=6 hb_src=0 hb_dst=0 flags0=0x10800a080020000a flags1=0x1d0120a10010 flagvalues=1,3,21,35,41,43,55,60,68,80,85,87,93,96,104,106,107,108 catid=83 user=0 luserid=0 usergp=0 hotspotuserid=0 hotspotid=0 dst_mac=11:11:11:11:11:11 src_mac=00:00:00:00:00:00 startstamp=1654062421 microflow[0]=INVALID microflow[1]=INVALID hostrev[0]=0 hostrev[1]=0 ipspid=0 diffserv=0 loindex=6 tlsruleid=0 ips_nfqueue=1 sess_verdict=0 gwoff=0 cluster_node=0 current_state[0]=11038 current_state[1]=11038 vlan_id=0 inmark=0x0 brinindex=21 sessionid=1430 sessionidrev=7201 session_update_rev=7 dnat_done=0 upclass=0:0 dnclass=0:0 pbrid_dir0=0 pbrid_dir1=0 nhop_id[0]=65535 nhop_id[1]=65535 nhop_rev[0]=0 nhop_rev[1]=0 conn_fp_id=NOT_OFFLOADED
    [UPDATE] proto=tcp proto-no=6 timeout=120 state=LAST_ACK orig-src=a.a.a.a orig-dst=52.97.179.226 orig-sport=37190 orig-dport=993 reply-src=52.97.179.226 reply-dst=b.b.b.b reply-sport=993 reply-dport=37190 [ASSURED] mark=0x8001 id=1941491456 masterid=0 devin=Port1 devout=Port2 nseid=16784884 ips=3 sslvpnid=0 webfltid=4 appfltid=0 icapid=0 policytype=1 fwid=5 natid=3 fw_action=1 bwid=0 appid=0 appcatid=0 hbappid=0 hbappcatid=0 dpioffload=0x3e sigoffload=0 inzone=1 outzone=2 devinindex=5 devoutindex=6 hb_src=0 hb_dst=0 flags0=0x10800a080020000a flags1=0x1d0120a10010 flagvalues=1,3,21,35,41,43,55,60,68,80,85,87,93,96,104,106,107,108 catid=83 user=0 luserid=0 usergp=0 hotspotuserid=0 hotspotid=0 dst_mac=11:11:11:11:11:11 src_mac=00:00:00:00:00:00 startstamp=1654062421 microflow[0]=INVALID microflow[1]=INVALID hostrev[0]=0 hostrev[1]=0 ipspid=0 diffserv=0 loindex=6 tlsruleid=0 ips_nfqueue=1 sess_verdict=0 gwoff=0 cluster_node=0 current_state[0]=11038 current_state[1]=11038 vlan_id=0 inmark=0x0 brinindex=21 sessionid=1430 sessionidrev=7201 session_update_rev=7 dnat_done=0 upclass=0:0 dnclass=0:0 pbrid_dir0=0 pbrid_dir1=0 nhop_id[0]=65535 nhop_id[1]=65535 nhop_rev[0]=0 nhop_rev[1]=0 conn_fp_id=NOT_OFFLOADED

    I also reproduced the scenario where there is no "In Interface" or "Out Interface" listed in the GUI firewall log with the "Could not associate packet to any connection" message, again where a.a.a.a is the internal server and b.b.b.b is the WAN IP. This time it is a Google server (35.207.140.42).

    GUI Firewall Log

    2022-06-01 06:54:56Firewall
    messageid="01001"
    log_type="Firewall"
    log_component="Invalid Traffic"
    log_subtype="Denied"
    status="Deny"
    con_duration="0"
    fw_rule_id="N/A"
    nat_rule_id="0"
    policy_type="0"
    user=""
    user_group=""
    web_policy_id="0"
    ips_policy_id="0"
    appfilter_policy_id="0"
    app_name=""
    app_risk="0"
    app_technology=""
    app_category=""
    vlan_id=""
    ether_type="IPv4 (0x0800)"
    bridge_name=""
    bridge_display_name=""
    in_interface=""
    in_display_interface=""
    out_interface=""
    out_display_interface=""
    src_mac=""
    dst_mac=""
    src_ip="35.207.140.42"
    src_country="DEU"
    dst_ip="b.b.b.b"
    dst_country="GBR"
    protocol="TCP"
    src_port="443"
    dst_port="64681"
    packets_sent="0"
    packets_received="0"
    bytes_sent="0"
    bytes_received="0"
    src_trans_ip=""
    src_trans_port="0"
    dst_trans_ip=""
    dst_trans_port="0"
    src_zone_type=""
    src_zone=""
    dst_zone_type=""
    dst_zone=""
    con_direction=""
    con_id=""
    virt_con_id=""
    hb_status="No Heartbeat"
    message="Could not associate packet to any connection."
    appresolvedby="Signature"
    app_is_cloud="0"

    Conntrack Output

    [DESTROY] proto=tcp      proto-no=6 orig-src=a.a.a.a orig-dst=35.207.140.42 orig-sport=58604 orig-dport=443 packets=15 bytes=1698 reply-src=35.207.140.42 reply-dst=b.b.b.b reply-sport=443 reply-dport=58604 packets=22 bytes=18137 [ASSURED] mark=0x8001 id=2886620800 masterid=0 devin=Port1 devout=Port2 nseid=16784937 ips=3 sslvpnid=0 webfltid=4 appfltid=0 icapid=0 policytype=1 fwid=5 natid=3 fw_action=1 bwid=0 appid=100 appcatid=5 hbappid=0 hbappcatid=0 dpioffload=0x3e sigoffload=0 inzone=1 outzone=2 devinindex=5 devoutindex=6 hb_src=0 hb_dst=0 flags0=0x10800a080020000a flags1=0x1d0124a00010 flagvalues=1,3,21,35,41,43,55,60,68,85,87,90,93,96,104,106,107,108 catid=29 user=0 luserid=0 usergp=0 hotspotuserid=0 hotspotid=0 dst_mac=00:00:00:00:00:00 src_mac=11:11:11:11:11:11 startstamp=1654062543 microflow[0]=INVALID microflow[1]=INVALID hostrev[0]=0 hostrev[1]=0 ipspid=0 diffserv=0 loindex=6 tlsruleid=1 ips_nfqueue=2 sess_verdict=0 gwoff=0 cluster_node=0 current_state[0]=11039 current_state[1]=11039 vlan_id=0 inmark=0x0 brinindex=21 sessionid=156 sessionidrev=12819 session_update_rev=10 dnat_done=0 upclass=0:0 dnclass=0:0 pbrid_dir0=0 pbrid_dir1=0 nhop_id[0]=65535 nhop_id[1]=65535 nhop_rev[0]=0 nhop_rev[1]=0 conn_fp_id=NOT_OFFLOADED

    Finally, I received another report of further timeouts from one of our users and can again correlate it to similar log messages from cloud services. However, I did notice a difference. This one doesn't have a message value but it has a web_policy_id and ips_policy_id value. I can see the corresponding Default Workplace Policy but I don't know how to identify ips_policy_id or the underlying reason but I see many blockages following this pattern around the time of the reported user issues.

    2022-05-31 16:59:44Firewall
    messageid="00002"
    log_type="Firewall"
    log_component="Firewall Rule"
    log_subtype="Denied"
    status="Deny"
    con_duration="0"
    fw_rule_id="5"
    nat_rule_id="0"
    policy_type="1"
    user=""
    user_group=""
    web_policy_id="4"
    ips_policy_id="3"
    appfilter_policy_id="0"
    app_name=""
    app_risk="0"
    app_technology=""
    app_category=""
    vlan_id=""
    ether_type="IPv4 (0x0800)"
    bridge_name=""
    bridge_display_name=""
    in_interface="Port1"
    in_display_interface="Port1"
    out_interface=""
    out_display_interface=""
    src_mac="00:00:00:00:00:00"
    dst_mac=""
    src_ip="a.a.a.a"
    src_country="R1"
    dst_ip="142.250.200.40"
    dst_country="USA"
    protocol="UDP"
    src_port="63158"
    dst_port="443"
    packets_sent="0"
    packets_received="0"
    bytes_sent="0"
    bytes_received="0"
    src_trans_ip=""
    src_trans_port="0"
    dst_trans_ip=""
    dst_trans_port="0"
    src_zone_type=""
    src_zone=""
    dst_zone_type=""
    dst_zone=""
    con_direction=""
    con_id=""
    virt_con_id=""
    hb_status="No Heartbeat"
    message=""
    appresolvedby="Signature"
    app_is_cloud="0"
    web_policy="Default Workplace Policy"

  • I am quite sure this is not an issue what so ever. It is simply a closing connection. So those packets are duplicated send and being logged as closing packets. 

    __________________________________________________________________________________________________________________

  • Ok, but I'm not so sure about the last scenario that I described as it definitely coincides with the errors that are being reported. Why are they being denied against "Default Workplace Policy"? Can we identify IPS policy 3?

  • It is a destroyed connection. So the connection is getting closed and deleted. 

    fwid=5 Show us a screenshot of this FW Rule. But likely you are chasing something, which is not important. 

    When conntrack is closing/Destroying the connection, it is because somebody (Client or Server) is sending a RST packet. This means, the client or the server (likely the client in this scenario) is closing the connection. 

    Those packets are often times send multiple times. Therefore logged as invalid traffic. There is no issue in this process what so ever. Your issue is a application issue. Something the app is causing and is closing the connection. 

    There is a TCP Handshake. Which means the connection on a TCP Level is there. But the other levels (TLS for example) is closing the connection.

    You see this in this: packets=15 bytes=1698 

    15 Packets are send between those clients. The firewall is not simply closing the connection at this point. Instead the client or server is closing the connection for whatever reason after the talked to each other (in fact 15 packets, which could be TLS handshake or something in the application). 

    __________________________________________________________________________________________________________________

  • Thanks for the comments, here is rule 5 as requested.

    I also took a screenshot of one of the examples that I've been examining in the firewall log where I have highlighted a Google IP (142.250.200.40) that is blocked several times between 16:59:44 and 16:59:48. The same URL is allowed but around 10 seconds later at 16:59:59 and this could coincide with the time that the user was eventually successful after multiple tries. It seems a bit long for an automatic retry.

  • Just to be sure. What is the issue, you see on a client? What are your user say? 

    Because this is a perfectly fine behavior. If the app is closed, it will send basically more packets. 

    __________________________________________________________________________________________________________________

  • The user is accessing a particular website and when they submit a form it sometimes times out but only on our internal network, i.e. going through the Sophos. We have confirmed that the application in question is using a variety of cloud services and this is why we are focussing on these errors. It is quite intermittent and eventually works after a refresh.

    I must be misinterpreting the logs if this is normal as the only success I see for this IP is 11 seconds after the last failure so I was assuming that they are different transactions.

  • Try to start to check the Developer tools of the browser to get the actual data resets. Maybe you see the reason there. 

    __________________________________________________________________________________________________________________

Reply Children
No Data
Share Feedback
×

Submitted a Tech Support Case lately from the Support Portal?